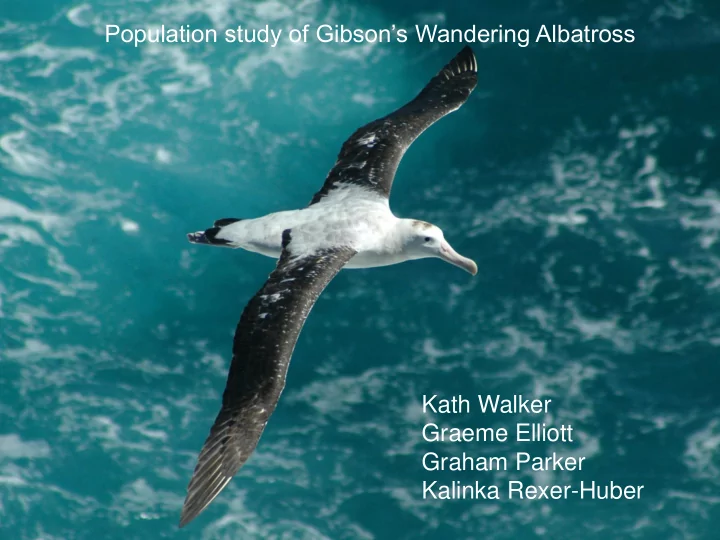

Population study of Gibson’s Wandering Albatross Kath Walker Graeme Elliott Graham Parker Kalinka Rexer-Huber
3000 2500 2000 Number of adults 1500 1000 All as in 1991 adsurv as in 1991 500 Psuccess as in 1991 Breeding proportion as in 1991 Status quo 0 1990 2000 2010 2020 2030
Chathams Bounties Snares Antipodes Aucklands Campbell Macquarie (Aus)
Chathams Bounties Snares Antipodes Aucklands Campbell Macquarie (Aus)
× ×
Wandering albatross breeding timetable • It takes a year to raise a chick – Lay in January – Chicks fledge in the following December – February • In one visit to the island in Jan – Feb you can collect all the data you need
– Assess the nesting success of the previous year’s nests and band the chicks in the study area – Band and resight birds nesting in the study area for mark-recapture analysis – Mark and map all the nests – Count the nests in the census blocks – Sufficient data for a population model
Nest counts 600 Rhys's Ridge 500 A to A 400 Fly Square Number of nests 2.7% 300 200 100 0 1998 2003 2008 2013
Mark-recapture estimates of the number of breeders 500 Females 450 Number of breeding birds Males 400 350 300 250 200 1998 2000 2002 2004 2006 2008 2010 2012 2014 2016
Proportion of females breeding 0.7 0.6 Proportion of females breeding 0.5 0.4 0.3 0.2 0.1 0 1995 2000 2005 2010 2015
Adult survival 1 Annual survival 0.9 male female 0.8 1993 1998 2003 2008 2013
Nesting success and productivity Nesting success 90 160 80 Chicks produced 140 70 Nesting success (%) 120 Chicks produced in study area 60 100 50 80 40 60 30 40 20 20 10 0 0 1991 1996 2001 2006 2011 2016
Southern Oscillation index vs Nesting success 2 0.9 0.8 La Niña - warmer High nesting success 1.5 0.7 Southern Oscillation index 1 0.6 Nesting succcess 0.5 0.5 0.4 0 0.3 0.2 -0.5 0.1 Low nesting success El Niño - cooler -1 0 1993 1998 2003 2008 2013
Pacific Decadal Oscillation index vs proportion 1.5 0.8 breeding 1 0.7 cooler warmer 0.5 0.6 Proportion breeding 0 0.5 PDO -0.5 0.4 -1 0.3 PDO -1.5 0.2 prop -2 0.1 breeding -2.5 0 1995 2000 2005 2010 2015
Geolocator dataloggers
Before 2005 23 Males
• Lower survival • Lower productivity • Foraging more widely • Things are starting to look up.
Recommend
More recommend