
SLIDE 1
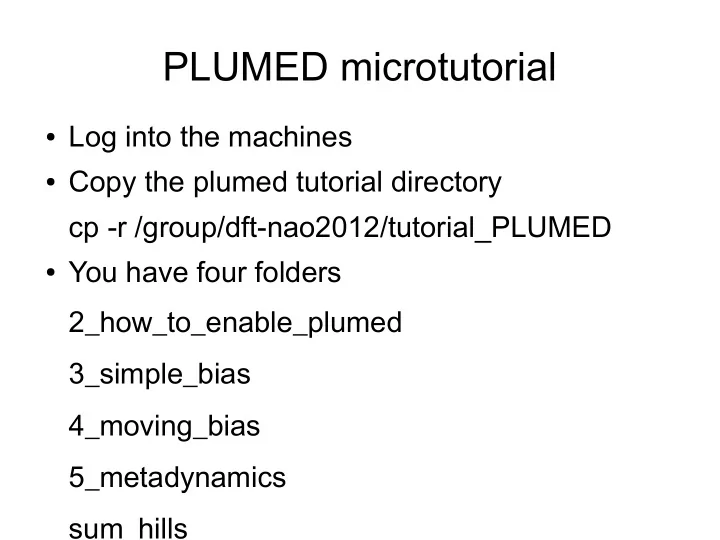
PLUMED microtutorial
- Log into the machines
- Copy the plumed tutorial directory
cp -r /group/dft-nao2012/tutorial_PLUMED
- You have four folders