PLANNING PROCESSES Santiago Carrillo Maria Mnica Salazar FOR MASS - - PowerPoint PPT Presentation

planning processes
SMART_READER_LITE
LIVE PREVIEW

PLANNING PROCESSES Santiago Carrillo Maria Mnica Salazar FOR MASS - - PowerPoint PPT Presentation

Francisca Benitez PLANNING PROCESSES Santiago Carrillo Maria Mnica Salazar FOR MASS TRANSIT SYSTEMS Santiago Silva Restrepo IN LATIN AMERICA Fernanda Villaseor Bogota - Colombia Bogota, Colombia Curitiba, Brazil Santiago - Chile Source:


slide-1
SLIDE 1

PLANNING PROCESSES FOR MASS TRANSIT SYSTEMS IN LATIN AMERICA

Bogota - Colombia Santiago - Chile

Francisca Benitez Santiago Carrillo Maria Mónica Salazar Santiago Silva Restrepo Fernanda Villaseñor

Source: Google

1

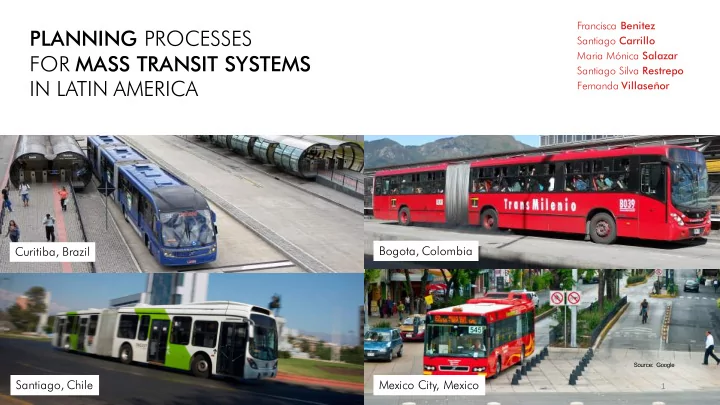
Curitiba, Brazil Bogota, Colombia Santiago, Chile Mexico City, Mexico

slide-2
SLIDE 2

WHAT IS A BUS RAPID TRANSIT SYSTEM?

Bus Rapid Transit (BRT) is a high quality bus-based transit system that delivers fast, comfortable, and cost-effective services at metro-level capacities

Source: www.brtdata.org

2

slide-3
SLIDE 3

3

SUMMARY

slide-4
SLIDE 4
  • Unclear property rights on the

curbside and on the road

  • Transporters collusion
  • Principal-agent problem between

drivers and owners (incentives misaligned)

  • Congestion
  • Pollution

MARKET FAILURES THAT AFFECT URBAN MASS TRANSIT PROVISION

slide-5
SLIDE 5
  • Reserve tracks and restrictive access

elevated stations (Platform-level boarding)

  • Fares can be set at the level a which

they finance long-term cost provision

  • Private bus owners charge by Km, not

per passenger, and drivers are employees with a fixed salary

  • Minimize congestion with busway

alignment, wide doors and off-board fare collection

HOW BRT CAN HELP TO SOLVE THOSE MARKET FAILURES

slide-6
SLIDE 6

CURITIBA, THE FIRST EXPERIMENT

  • Initially planned in 1965, the Rede

Integrada de Transporte began

  • perations in 1974
  • Curitiba has 1.87 million habitants and

its BRT transports 0.56 million per day in 7 corridors with 123 stations and 83.9 Km

  • Standard fare $0.86 USD
  • Busses operate with Biodiesel and

diesel

slide-7
SLIDE 7

TRANSMILENIO

Bogotá, Colombia IMPLEMENTED IN 2000

slide-8
SLIDE 8

Bogotá’s transportation system was

  • ne of the least efficient in the
  • region. In terms of vehicles per

capita, age of fleet, average speed

  • n rush hour.

However, the demand for public transportation was only comparable to Quito, Ecuador.

slide-9
SLIDE 9
  • 112.9 km and 14 km of ongoing construction

in carrera 7

  • 137 stations (including six stations at calle 6

and Soacha)

  • 2,213,236 passengers per day and
  • 565,100,000 annual passenger boardings
  • 12 corridors (Calle 80, Caracas, Caracas Sur,

Eje Ambiental, Norte, Américas, NQS central, NQS sur, Suba, Calle 26, Carrera 10 and Carrera 7)

slide-10
SLIDE 10

PROS

  • Capacity (compared to prior model)
  • Efficiency in terms of number of trips and

users

  • Primary stage of integrated transportation

system

slide-11
SLIDE 11

CONS

  • Centralized planning
  • Deficient exclusive road network.
  • Capacity (demand growth rate of

12.8%)

slide-12
SLIDE 12

METROBUS

Mexico City, Mexico IMPLEMENTED IN 2005

slide-13
SLIDE 13

Baseline transportation prior to BRT

  • 3.5 million passenger cars
  • 180,000 motorcycles
  • 130,000 taxis
  • 30,000 public transit buses
  • 200 kilometers subway
  • June 2005
  • 125 km of exclusive bus lanes enabled
  • 177 stations throughout 6 lanes (corridors)
  • 1,065,000 passengers per day
  • Replaced 350 standard buses with 97 new

articulated BRT vehicles.

slide-14
SLIDE 14
  • 2002 World Resources Institute (EMBARQ-WRI)
  • 5-year agreement à Mexico City government, Ministry
  • f Environment: Sustainable Transportation Program in

Mexico City

  • Center for Sustainable Transportation, result of joint

efforts of three entities: an international organization, EMBARQ-WRI; a government entity, the Government of Mexico City, and a Mexican non-governmental

  • rganization, the CeIBA.

PLANNING PROCESS

slide-15
SLIDE 15

METROBUS TRANSPORT PRIVATE ENTITIES 10 FIRMS PRIVATE TRUSTS ONE PRIVATE TRUST PER EACH LINE COLLECTION ENTITIES FIVE COMPANIES

slide-16
SLIDE 16

TRANSANTIAGO

Santiago, Chile IMPLEMENTED IN 2007

slide-17
SLIDE 17

The policy of low entry costs and unrestricted competition applied in the 1990s allocated resources inefficiently – competition among the buses, metro, and taxis generated a disorganized, nonintegrated system that forced users to assume a major monetary expense and use multiple forms of transportation.”

Font, M. (2015). Transantiago: Urban Development in Chile. In The State and the Private Sector in Latin America (pp. 157-178). Palgrave Macmillan US.

slide-18
SLIDE 18
  • 108 kms (67 miles) of exclusive bus lanes

enabled

  • 11% bus quantity increase
  • Number of transactions per day: 3,227,563
  • Number of bus stops: 11,325

Created under an evolving framework and based

  • n public-private collaboration.

Network of institutional, business, and public actors running and supervising its components.

slide-19
SLIDE 19

CONS

Plan implementation and operation Bus frequency Technology failures Mayor political disagreements Failure to educate community

slide-20
SLIDE 20

PROS

Environmental Impact Smart card fare and collection system Increased Public Safety

slide-21
SLIDE 21
slide-22
SLIDE 22

TRANSMILENIO TRANSANTIAGO METROBUS

Bogotá Santiago México City PLAN DESIGN Local Authorities Private-Public partnership Local Authorities, International Non-Profit and local NGO PLAN IMPLEMENTATION Local Authorities National Government Local Authorities FINANCING National, Local and Multilateral Bank Government Subsidy Global Environmental Fund Shell Foundation Government of Mexico City MAIN CHALLENGES

  • Capacity
  • Centralized planning
  • Negative spillovers on

secondary routes

  • Major political

disagreements in the implementation phase

  • High expectations
  • Opposition groups
  • Levels of service
slide-23
SLIDE 23

FINAL REMARKS

  • Ideally, a scheme of decentralization in the provision of public services

should be under the responsibility of the level of Government that responds directly to the users and beneficiaries of this.

  • However, centralized planning is often used to minimize the high costs of

investment and deficiencies in technical knowledge for local authorities.

  • This results in a process of coordination between different levels of

Government that many times ends in the imposition of the national agenda over the local one.