
SLIDE 1
PINAR ENTEGRE ET VE UN SAN. A. . PINAR ENTEGRE ET VE UN SAN. A. . - - PowerPoint PPT Presentation
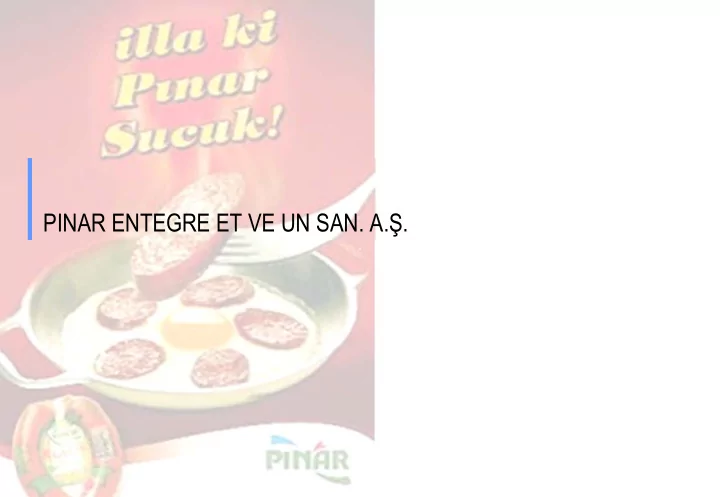
PINAR ENTEGRE ET VE UN SAN. A. . PINAR ENTEGRE ET VE UN SAN. A. . Company History 1985... Trkiyes first private integrated modern meat plant P nar Meat was established. 2010 1998 Meat obtained at slaughterhouse under 2004
Page 1
Pınar Et
1985...
Türkiye’s first private integrated modern meat plant Pınar Meat was established. Meat obtained at slaughterhouse under hygienic conditions and fully-automated packages sausage flavored with garlic, salami, sausages and other delicatessen products were appreciated by the consumers.
1988
Birmaş Markets were established to sell carcase meat products by Pınar Meat.
1998
Pınar established first full-integrated turkey production facilities in Turkey and introduced white turkey meat.
2001
Pınar Meat produces traditional Turkish döner food, preserving its original taste, and offered for sale throughout Turkey.
2004
Pınar Meat was granted TS ISO 14001 Environmental Management System
2009
New Launches
(Meatballs)
Alaturka
2003
Pınar Meat passed to TS ISO 9001-2000 Certificate.
2004
Nine varieties of meat balls were introduced under the concept of Türkiye’s Meat Balls.
2008
Pınar Et started Lean 6 Sigma implementation as a first implementing institution of Turkish Food Sector.
1994
Pınar Meat became first meat production Company to which TS ISO 9002 Quality System Certificate has been awarded.
2001
Pınar Meat, realised production of frozen sea products.
1987
First hamburger meatball in Türkiye was produced upon cooperation between Pınar Meat and McDonald’s. Pınar Meat introduced frozen ready food to the Turkish people.
2000
Pınar Meat produced sliced delicatessen varieties at full-automated modern facilities called by ‘Clean Room’
2010
soudjouk product group that can be consumed at one time was created for our customers
added to Pınar Pizza family
"Gourmet Burger" was added to the frozen product family
Page 2
Pınar Et
Food & Beverage have 45,4 % of all FMCG 9M 2009 9M 2010 Size of Total Market (000 TL) Fast-Moving Cosumer Goods (Including Cigarette)
14,2 %
37,799,000 43,149,000
Share of Size %
9M 2010
PERCONAL CARE; CIGARETTE; 41,5 OTHER; 0,6 CLEANING; 4,4 FOOD AND BEVERAGES 45,7
Kaynak: Nielsen, Eylul 2010
PERCONAL CARE; CIGARETTE; 41,5 OTHER; 0,6 CLEANING; 4,4 FOOD AND BEVERAGES 45,7
Kaynak: Nielsen, Eylul 2010 Source: Nielsen, September 2010
Page 3
Pınar Et
1.4 1.4 Other Cleaning Products SPENDING SHARE % 0.3 0.3 Other 5.0 5.1 Laundry - Dishwashing Products 6.5 6.5 Cleaning Products 3.4 3.2 Paper Products 1.4 1.3 Hair Care Products 2.8 2.6 Body Care Products 7.6 7.1 Personal Care Products 8.8 8.9 Other Food Product 13.2 13.2 Beverage 8.9 8.6 Snacks 15.7 15.1 Dairy Products 5.7 6.2 Oils 18.1 18.4 Meat & Meat Products 15.3 15.5 General Food Products 85.6 86.0 Food & Beverage 100 100 FAST-MOVING CONSUMER GOODS 9M 2010 9M 2009 1.4 1.4 Other Cleaning Products SPENDING SHARE % 0.3 0.3 Other 5.0 5.1 Laundry - Dishwashing Products 6.5 6.5 Cleaning Products 3.4 3.2 Paper Products 1.4 1.3 Hair Care Products 2.8 2.6 Body Care Products 7.6 7.1 Personal Care Products 8.8 8.9 Other Food Product 13.2 13.2 Beverage 8.9 8.6 Snacks 15.7 15.1 Dairy Products 5.7 6.2 Oils 18.1 18.4 Meat & Meat Products 15.3 15.5 General Food Products 85.6 86.0 Food & Beverage 100 100 FAST-MOVING CONSUMER GOODS 9M 2010 9M 2009
Meat and Meat Products; Has the greatest share of food and beverages category by 18%.
Source: IPSOS, September 2010
Page 4
Pınar Et
Meat and Meat Products Sector in Turkey
USD
billion USD) (Total market is estimated to be around 200 thousand tons.)
PROCESSED MEAT MARKET (tons) PENETRATION %
Source: IPSOS KMG
2010 9M (TL) Delicatessen 913 Million Ready Meals 81 Million
14 Million
67 Million
Source: Ipsos KMG, retail only
59.323 60.210 58.664 57.000 58.000 59.000 60.000 61.000 2008 9 M 2009 9 M 2010 9M
98,4 98,5 93,1 92,8 93,9 99,0 4,2 3,0 3,6 84,1 80,4 82,4 83,4 83,8 84,3 20 40 60 80 100 YTD Sept'08 YTD Sept'09 YTD Sept'10
Meat & meat products Turkey Red Meat Poultry Delicatessen
Source: Nielsen
Page 5
Pınar Et
Growth Potential
38,4 69,1 63,6 37,5 75,4 62,9 39,6 80,6 69,6
0,0 10,0 20,0 30,0 40,0 50,0 60,0 70,0 80,0 90,0 Soudkjouk Sausage Salami
YTD Sep'08 YTD Sep'09 YTD Sep'10
the first nine months
83,4% of households in Turkey at least
consumed delicatessen products and 85% of these households repeated their purchases.
8.1% between 2003-2009. Shift From Unpackaged to Packaged Volume (%)
1% 13%
7% 18% Source: Ipsos KMG
Growth Potential
very low compared to EU (EU=66 kg ; TR=28 kg)
from 28 kg to 30 kg.
Russian markets
101 66 28 20 40 60 80 100 120 USA EU Türkiye
Page 6
Pınar Et
Leader in processed meat category with 20% market share
PRODUCT MARKET SHARE POSITION
FROZEN READY MEAL (MEAT) 57% LEADER SALAMI 34% LEADER SAUSAGE 27% LEADER SOUJOUK 16% LEADER TOTAL DELICATESSEN 20% LEADER
Aytac, Polonez, Banvit and Maret.
processed meat sector.
MARKET SHARE COMPARISON
Source: Nielsen
10 20 30 40 50 60 70 Frozen Ready Meal Salami Sausage Soujouk Pınar Best Competitor
Page 7
Pınar Et
New Products:
Misket Köfte (meatballs)
Many new products were launched to the market
Product Differantiation:
Diversification of the new packaging that responds to market trends :easy-open, optimum shelf life, smaller packaging
Page 8
Pınar Et
Strong brand equity, market segment leader in many sub FMCG More than 300 SKU’s 1000 employees High levels of consumer satisfaction Diversified suppliers of live animals Powerful distribution network (access to 155 000 sales points) Technical experience & industry technical knowledge (know how) High quality, hygienic production in the EU standards Competitive cost structure and ongoing cost improvement Advanced IT (Information Technology) applications (SAP systems connected to the dealers)
One of the leading enterprises in FMCG sector in Turkey In 2009,, 75% of all households in Turkey bought at least one Pınar Product
S
OS Household Panel December’ 09
Page 9
Pınar Et
Distribution Channels Product Groups
16% 4% 49% 31%
Delicatessen Frozen Meal Meat Other
80% 18% 2%
YBP DIRECT EXPORT
According to net sales for 2010 ıH.
Page 10
Pınar Et
Know how, strong relationship with farmers, high quality in supplied meat
Purchase operations spread out 6 territories with 10 vets and agriculture engineers, 7,000 farmers, yearly 50,000 cattles supply. Improves and supports “Contracted Stockfarming” in order to supply best quality cattle under control of Vets Red meat is procured primarily from cattle farmers in Turkey All live turkeys and a small part of cattles is sourced from the Group’s agribusiness unit, Çamlı Yem Besicilik The Group aims to sustain and further develop its competitive advantage in the meat industry by continuing to adopt policies for food safety and traceability
Page 11
Pınar Et
Quality & Hygiene at all stages of production, and more rigorous internal quality control
Turkey’s first integrated meat process facility Through continuous investment in modern and efficient production technologies Use of modern technology in production lines
İzmir- (16 product lines)
Total Area : 330,000 m2 Closed Area : 46.000 m2
sector, TSE-ISO-EN 9000, 14000, 18001, 22000
in Turkey.
High level of hygiene and quality at every stage
Page 12
Pınar Et
As of 11 November 2010;
Pınar Süt A.Ş. 13% Yaşar Holding A.Ş. 54% Free Float 33%
Absolute and Relative Performance of Pınar Et (Relative to ISE-100)
115,35 6,60
40 60 80 100 120 140 160 Dec-09 Feb-10 Mar-10 Apr-10 Jun-10 Jul-10 Aug-10 Oct-10 1 2 3 4 5 6 7 8 Relative to ISE-100 (Left Axis) PETUN (Right Axis)
Page 13
Pınar Et
Yaşar Birleşik Pazarlama Dağıtım Turizm ve Ticaret A.Ş. (YBP) Share % 38.26% Carrying Value 71.7 M TL Sales and distribution of meat & other food products
Share % 23.38% Carrying Value 17.3 M TL Agriculture-Food production, fish, veal and turkey for fattening Çamlı Yem, Besicilik
Share % 44.94% Carrying Value 2.7 M TL Distibution and sale of milk and meat products being produced in Europe and distribution of imported Pınar Su products . Pınar Foods GmbH, Germany Share % 20.00% Pınar Anadolu Gıda
Carrying Value 0.6 M TL Production of milk and meat products in Yozgat Desa Enerji Elektrik Üretimi Otoprodüktör Grubu Share % 26.41% Carrying Value 2.9 M TL Energy production in İzmir
Page 15
Pınar Et
NET SALES (Million TL)
219 247 281 306 308
2005 2006 2007 2008 2009 CAGR + %9 EBITDA (Million TL)
25 27 39 38 48
2005 2006 2007 2008 2009 CAGR + %20 NET PROFIT (Million TL)
16 23 30 32 40
2005 2006 2007 2008 2009 CAGR + %25
Page 16
Pınar Et
(Millon TL) 30 September 2010 30 September 2009 Diff. % Change Operating Revenue
270,5 229,0 41,5 18,1
Cost of Sales
(226,0) (178,8) (47,2) 26,4
Gross Profit
44,6 50,2 (5,7) (11,3)
Ar&Ge Giderleri
(0,6) (0,6) (0,1) 12,9
Selling and Marketing Expenses
(11,4) (13,6) 2,2 (16,5)
General and Administrative Expenses
(9,4) (8,8) (0,6) 7,1
EBIT
23,2 27,3 (4,1) (15,1)
Share of Results of Investments in Associates
9,1 6,7 2,4 35,2
Other Income
0,8 1,0 (0,1) (12,5)
Other Expenses
(0,0) (1,8) 1,8 (98,5)
Financial Income / (Expense) - (Net)
3,2 2,5 0,6 25,6
INCOME BEFORE TAX
36,2 35,7 0,5 1,5
Taxes on Income
(5,7) (6,2) 0,6 (9,2)
NET PROFIT FOR THE YEAR
30,5 29,4 1,1 3,8
EBITDA
29,9 33,8 (4,0) (11,7)
Totat Assets
348,2 333,7 14,5 4,4
Shareholders' Equity
269,3 259,2 10,0 3,9
Page 17
Pınar Et
GROSS PROFIT MARGINS (%)
21,3 21,1 21,9 16,5 0,0 5,0 10,0 15,0 20,0 25,0
2008 2009 2009 9 Months 2010 9 Months OPERATING PROFIT MARGINS * (%)
10,7 10,8 11,9 8,6
0,0 2,0 4,0 6,0 8,0 10,0 12,0 14,0
2008 2009 2009 9 Months 2010 9 Months EBITDA MARGINS ** (%)
13,5 13,7 14,8 11,0
0,0 2,0 4,0 6,0 8,0 10,0 12,0 14,0 16,0
2008 2009 2009 9 Months 2010 9 Months NET PROFIT MARGINS (%)
10,4 13,0 12,8 11,3
0,0 2,0 4,0 6,0 8,0 10,0 12,0 14,0
2008 2009 2009 9 Months 2010 9 Months
Ex.Other income and expenditures ** Earnings before Interest, Tax, Depreciation, and Amortization
Page 18
Pınar Et
NET SALES (Million TL)
86 99 89
2009 III.Q 2010 III.Q 2010 II.Q
power of consumers
price increases.
EBITDA (Million TL)
13,3 9,5 10,5
2009 III.Q 2010 III.Q 2010 II.Q
in certain rate considering consumer purchasing power.
savings in costs made profitability remains at the same level compared to last year.
Page 19
Pınar Et
30 September 2010 31 December 2009 Current Ratio 1,9 2,0 Leverage Ratio 0,2 0,2 ST Fin'al Debt/Total Fin'al Debt 0,2 0,1 Net Fin'al Debt/EBITDA 0,4 0,2 Total Fin'al Debt/Equity 0,05 0,04 (Million TL) 30 September 2010 31 December 2009 Cash & Cash Equivalents 0,3 2,3 S/T Bank Borrowings 2,3 0,6 L/T Bank Borrowings 9,9 10,8 Net Financial Debt 11,8 9,1
10 20 30 40 50 Mar.08 June.08 Sep.08 Dec.08 Mar.09 June.09 Sep.09 Dec.09 Mar.10 June.10 Sep.10 (Millon TL)
Trade Receivables Trade Payables Inventories
Page 20
Pınar Et
Starting in the second half of 2009 and continued in 2010 due to a decrease in the supply of red meat, red meat as an extraordinary rise in prices took place. Rise of the raw material inputs could not be totally reflected to prices because of the lower change in purchasing power of the consumers. Focused on high value added products. Smaller package products were produced appropriate for purchasing power of the consumers. Cost saving measures, effective inventory management and lower costs Projects designed to improve efficiency in production have continued. With the power of our brand, production expertise and effective distribution channels, in the first 9 months of 2010, we attained similar level of profitability to 2009.
Page 21
Pınar Et
This presentation does not constitute an offer or invitation to purchase or subscription for any securities and no part of it shall form the basis of or be relied upon in connection with any contract or commitment whatsoever. This presentation contains forward-looking statements that reflect the company management’s current views with respect to certain future events. Although it is believed that the expectations reflected in these statements are reasonable, they may be affected by a variety of variables and changes in underlying assumptions that could cause actual results to differ materially. Neither Pınar Et nor any of its affiliates, advisors, representatives, directors, managers or employees nor any other person shall have any liability whatsoever for any loss arising from any use of this presentation or its contents or otherwise arising in connection with it. Company’s financial statements are available on www.kap.gov.tr and www.pinar.com.tr websites.
Invesrtor Relations Departmant
Tel: 90 232 482 22 00 Fax: 90 232 484 17 89 yatirimci@pinaret.com.tr