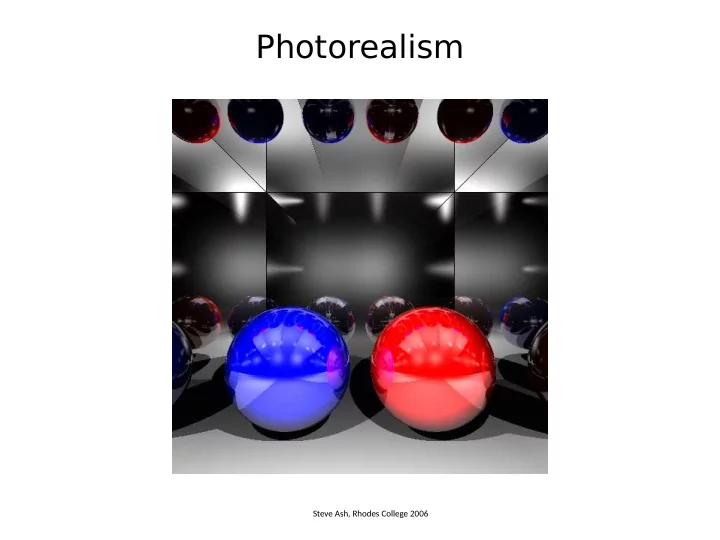
SLIDE 1 Photorealism
Steve Ash, Rhodes College 2006
SLIDE 2
T exture Mapping
+ = + =
SLIDE 3
T exture Mapping
+ =
Given the intersection point P between the sphere and ray R, map the Cartesian coordinates (x, y, z) of P to (u, v) coordinates in the image to pick a color P(x, y, z) C(i, j)
SLIDE 4
T exture Mapping
+ =
Given the intersection point P between the sphere and ray R, map the Cartesian coordinates (x, y, z) of P to (u, v) coordinates in the image to pick a color P(x, y, z) C(i, j)
SLIDE 5 Polar Coordinates
A point in the plane can be described by
(x, y) coordinates – Cartesian coordinates (r, θ) coordinates – Polar coordinates
image source: http://en.wikipedia.org/wiki/File:Polar_to_cartesian.svg
SLIDE 6 Polar => Cartesian
Given the (r, θ) polar coordinates what are the (x, y) Cartesian coordinates
x = r cosθ y = r sinθ
image source: http://en.wikipedia.org/wiki/File:Polar_to_cartesian.svg
SLIDE 7 Cartesian => Polar
Given the (x, y) Cartesian coordinates what are the (r, θ) Polar coordinates
r = sqrt( x2 + y2 ) θ = atan( y / x )
image source: http://en.wikipedia.org/wiki/File:Polar_to_cartesian.svg
SLIDE 8 Spherical Coordinates
A point in 3D space can be described by
(x, y, z) coordinates – Cartesian coordinates (r, θ, φ) coordinates – Spherical coordinates (θ, φ – latitude, longitude)
image source: http://en.wikipedia.org/wiki/File:Coord_system_SZ_0.svg
x z y r z x y N U V
SLIDE 9 Spherical => Cartesian
Given the (r, θ, φ) spherical coordinates what are the (x, y, z) Cartesian coordinates
x = r sin φ sinθ (based on the second diagram) y = r cos φ z = r sin φ cosθ
image source: http://en.wikipedia.org/wiki/File:Coord_system_SZ_0.svg
x z y r z x y N U V
SLIDE 10 Spherical => Cartesian
Given the (x, y, z) Cartesian coordinates what are the (r, θ, φ) Spherical coordinates
r = sqrt( x2 + y2 + z2 ) θ = atan ( x / z ) use C function atan2( a, b ) – range is [-π .. π] φ = acos ( y / r ) use C function acos( a ) – range is [0 .. π]
These formulas are for P(x, y, z) on sphere centered at origin For sphere not centered at origin correct coordinates of P
image source: http://en.wikipedia.org/wiki/File:Coord_system_SZ_0.svg
x z y r z x y N U V
SLIDE 11
T exture Mapping
+ =
Given the intersection point P between the sphere and ray R, map the Cartesian coordinates (x, y, z) of P to (u, v) coordinates in the image to pick a color
correct (x, y, z) as if sphere is centered at origin convert the Cartesian (x, y, z) to Spherical (r, θ, φ) keep only (θ, φ) range of θ is [-π .. π] and of φ is [0 .. π] compute u = f(θ) and v = g(φ) so that range of u and v is [0..1] compute i = u ∙ imageWidth j = v ∙ imageHeight set color of P to color at image[ i ][ j ]
P(x, y, z) C(i, j) for sphere
SLIDE 12
T exture Mapping
+ =
Given the intersection point P between the sphere and ray R, map the Cartesian coordinates (x, y, z) of P to (u, v) coordinates in the image to pick a color
correct (x, y, z) as if shape is centered at origin convert the Cartesian (x, y, z) to Parametric form (α, β, γ) keep any two (α, β) range of α is [α0 .. α1] and of β is [β0 .. β1] compute u = f(α) and v = g(β) so that range of u and v is [0..1] compute i = u ∙ imageWidth j = v ∙ imageHeight set color of P to color at image[ i ][ j ]
P(x, y, z) C(i, j) in general
SLIDE 13 T exture Mapping (Interpolation)
+ =
The computed coordinates (i, j) will not be integers, in
- general. To have smooth color change, interpolate the
colors of neighboring pixels.
Suppose i = 2 and j = 5.5 What should we use for C1 ?
P(x, y, z) C(i, j) C1 UL LL UR LR (2, 5) (3, 5) (3, 6) (2, 6)
SLIDE 14 T exture Mapping (Interpolation)
+ =
The computed coordinates (i, j) will not be integers, in
- general. To have smooth color change, interpolate the
colors of neighboring pixels.
Suppose i = 2 and j = 5.5 What should we use for C1 ? C1 = 0.5 ∙ image[ UL ] + 0.5 ∙ image[ LL ]
P(x, y, z) C(i, j) C1 UL LL UR LR (2, 5) (3, 5) (3, 6) (2, 6)
SLIDE 15 T exture Mapping (Interpolation)
+ =
The computed coordinates (i, j) will not be integers, in
- general. To have smooth color change, interpolate the
colors of neighboring pixels.
Suppose i = 2 and j = 5.7 What should we use for C1 ?
P(x, y, z) C(i, j) C1 UL LL UR LR (2, 5) (3, 5) (3, 6) (2, 6)
SLIDE 16 T exture Mapping (Interpolation)
+ =
The computed coordinates (i, j) will not be integers, in
- general. To have smooth color change, interpolate the
colors of neighboring pixels.
Suppose i = 2 and j = 5.7 What should we use for C1 ? C1 = 0.7 ∙ image[ UL ] + 0.3 ∙ image[ LL ] C1 = frac ∙ image[ UL ] + (1-frac) ∙ image[ LL ]
P(x, y, z) C(i, j) C1 UL LL UR LR (2, 5) (3, 5) (3, 6) (2, 6)
SLIDE 17 T exture Mapping (Interpolation)
+ =
The computed coordinates (i, j) will not be integers, in
- general. To have smooth color change, interpolate the
colors of neighboring pixels.
Let i0 = i – floor(i) and i1 = ceil(i) – i = 1 - i0
j0 = j – floor(j) and j1 = ceil(j) – j = 1 - j0
Compute C1 = j0 ∙ image[ UL ] + j1 ∙ image[ LL ] C2 = j0 ∙ image[ UR ] + j1 ∙ image[ LR ] C = i0 ∙ C2 + i1 ∙ C1
P(x, y, z) C(i, j) i0 j0 i1 j1 C1 C2 UL LL UR LR
SLIDE 18 T exture Mapping (Interpolation)
+ =
The computed coordinates (i, j) will not be integers, in
- general. To have smooth color change, interpolate the
colors of neighboring pixels.
Let i0 = i – floor(i) and i1 = ceil(i) – i = 1 - i0
j0 = j – floor(j) and j1 = ceil(j) – j = 1 - j0
Compute C1 = j0 ∙ image[ UL ] + j1 ∙ image[ LL ] C2 = j0 ∙ image[ UR ] + j1 ∙ image[ LR ] C = i0 ∙ C2 + i1 ∙ C1
P(x, y, z) C(i, j) i0 j0 i1 j1 C1 C2 UL LL UR LR use % for indices to wrap around the image when looking up neighbors
SLIDE 19
Bump Mapping
SLIDE 20
Bump Mapping
+ = + =
SLIDE 21
Bump + T exture
+ =
SLIDE 22
Bump Mapping
Perturb the normal slightly before returning it – this will cause the illumination equation to compute different rays, and therefore, different shadow patterns C P Norig ray Npert Lorig Lpert
SLIDE 23
Bump Mapping
Perturbing the normal in 3D
calculate vectors U, V that are perpendicular to N (i.e. tangential to sphere)
Calculating U, V, N vectors using Spherical coordinates:
N = (x, y, z) = (sin φ sin θ, cos φ, sin φ cos θ) U = ∂N/ ∂θ = ( cos θ, 0, - sin θ ) V = ∂N/ ∂φ = (cos φ sin θ, -sin φ , cos φ cos θ )
All vectors are already normalized N U V N U
Npert= N + u U + v V ∙ ∙
V v V ∙ u U ∙ Npert Easier to find in Cartesian since V perp. to N and y-axis Find V=(vx, 0, vz) perp. to N Find U perp. to both N and V
SLIDE 24
Bump Mapping
Perturbing the normal in 3D
calculate vectors U, V that are perpendicular to N (i.e. tangential to sphere)
N N
Npert= N + u U + v V ∙ ∙
The range of u, v is [-1..1] and they are calculated from the bump map using interpolation, i.e. a similar principle as in texture mapping For smoother approximation:
u = (image( i + 1, j ) – image( i - 1, j )) / 2 horizontal difference v = (image( i, j + 1 ) – image( i, j - 1 )) / 2 vertical difference
Npert U V V v V ∙ U u U ∙
SLIDE 25 PPM Image Format
P6 PPM type identifier 475 238 width height 255 max value per color channel r, g, b ÙÙ×ÎÖÖÙÙ×ÙÙ×ÎÖÖ... triples of rgb values (one byte per channel), rgbrgbrgbrgbrgb... range is [0..255] -- convert to [0..1] <-row0-><-row1->..
Create a class Image that stores in 2D array the color intensities in a PPM image
method that loads a PPM image (see Canvas class for saving a PPM image)
- perator () , so that image(j, j) returns an interpolated value
method that converts to grayscale – replace each color(r,g,b) with intensity(r,g,b) where intensity(r, g, b) = 0.299∙r + 0.587∙g + 0.114∙b
texture map bump map
+ + =
SLIDE 26
Cylinder T exture Mapping
Find the intersection point P(x, y, z) and correct for center at origin Convert to cylindrical coordinates P’(r, θ, y) x = R * sin θ y = y z = R * cos θ Find y and θ (with atan2 only; y is known already) y is in range [-H/2..+H/2] θ is in range [-π..π] Compute u and v u = θ converted to range [0..1] v = y converted to range [0..1] Compute i and j
i = u ∙ imageWidth
j = v ∙ imageWidth R H P(x,y,z) θ x y z may use 1-v to flip image upside down
SLIDE 27 Cylinder Bump Mapping
Find the intersection point P(x, y, z) Find the unit normal N and vectors U and V so that N,U,V are mutually perpendicular Compute u and v as difference of neighboring color intensities Use u and v to perturb the normal as in the case for spheres
P(x,y,z)
N U V x y z U and N are easy to find V is perpendicular to them but same as sphere works so use that for consistency
SLIDE 28
Cone T exture Mapping
Find the intersection point P(x, y, z) and correct for top at origin Convert to parametric form x = |y| / H * Rx * sin θ y = y z = |y| / H * Rz * cos θ Find |y| and θ (with atan only; y is known already) |y| is in the range [0..H] θ is in the range [-π..π] Compute u and v u = θ converted to the range [0..1] v = |y| converted to the range [0..1] Compute i and j
i = u ∙ imageWidth
j = v ∙ imageWidth H P(x,y,z) θ x y z
SLIDE 29 Cone Bump Mapping
Find the intersection point P(x, y, z) Find the unit normal N and vectors U and V so that N,U,V are mutually perpendicular Compute u and v as as difference of neighboring color intensities Use u and v to perturb the normal as in the case for spheres
P(x,y,z)
N U V x y z Find V=(vx, 0, vz) perp. to N Find U perp. to both N and V
SLIDE 30
Ellipsoid T exture Mapping
Find the intersection point P(x, y, z) and correct for center at origin Convert to parametric form x = Rx * sin φ * sin θ y = Ry * cos φ z = Rz * sin φ * cos θ Find φ and θ (with atan2, acos only )
φ is in the range [0..π]
θ is in the range [-π..π] Compute u and v u = θ converted to the range [0..1] v = φ converted to the range [0..1] Compute i and j
i = u ∙ imageWidth
j = v ∙ imageWidth x y z Ry Rx Rz P(x,y,z)
SLIDE 31 Ellipsoid Bump Mapping
Find the intersection point P(x, y, z) Find the unit normal N and vectors U and V so that N,U,V are mutually perpendicular Compute u and v as as difference of neighboring color intensities Use u and v to perturb the normal as in the case for spheres
P(x,y,z)
N U V x y z Find V=(vx, 0, vz) perp. to N Find U perp. to both N and V
SLIDE 32
Hyperboloid T exture Mapping
Find the intersection point P(x, y, z) and correct for center at origin Convert to parametric form x = Rx * sqrt(1 + h^2) * sin θ y = H * h z = Rz * sqrt(1 + h^2) * cos θ Find y and θ (with atan2 only and without sqr/sqrt; y is known already) y is in the range [-Hb..Ha] θ is in the range [-π..π] Compute u and v u = θ converted to the range [0..1] v = h converted to the range [0..1] Compute i and j
i = u ∙ imageWidth
j = v ∙ imageWidth x y z P(x,y,z) Rz Rx Ha Hb may use 1-v to flip image upside down H = max(Ha, Hb)
SLIDE 33
Hyperboloid Bump Mapping
Find the intersection point P(x, y, z) Find the unit normal N and vectors U and V so that N,U,V are mutually perpendicular Compute u and v as as difference of neighboring color intensities Use u and v to perturb the normal as in the case for spheres x y z P(x,y,z) N U V Find V=(vx, 0, vz) perp. to N Find U perp. to both N and V