
SLIDE 1
5/5/2017 1
1
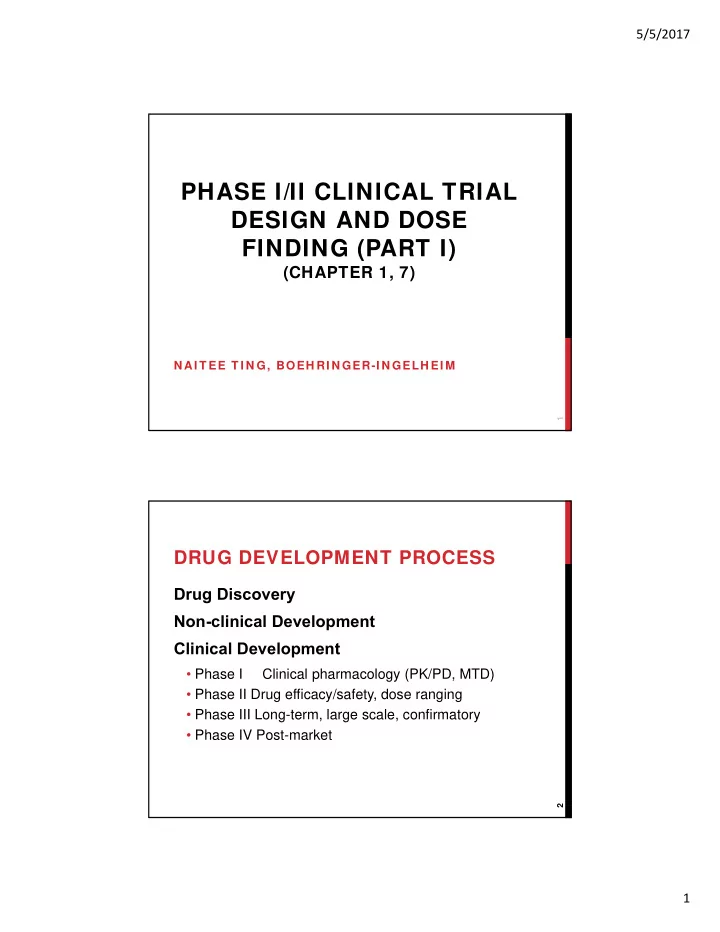
PHASE I/II CLINICAL TRIAL DESIGN AND DOSE FINDING (PART I)
(CHAPTER 1, 7)
N AI T EE T I N G, BOEH RI N GER-I N GELH EI M
2
DRUG DEVELOPMENT PROCESS
Drug Discovery Non-clinical Development Clinical Development
- Phase I
Clinical pharmacology (PK/PD, MTD)
- Phase II Drug efficacy/safety, dose ranging
- Phase III Long-term, large scale, confirmatory
- Phase IV Post-market