
SLIDE 1
1
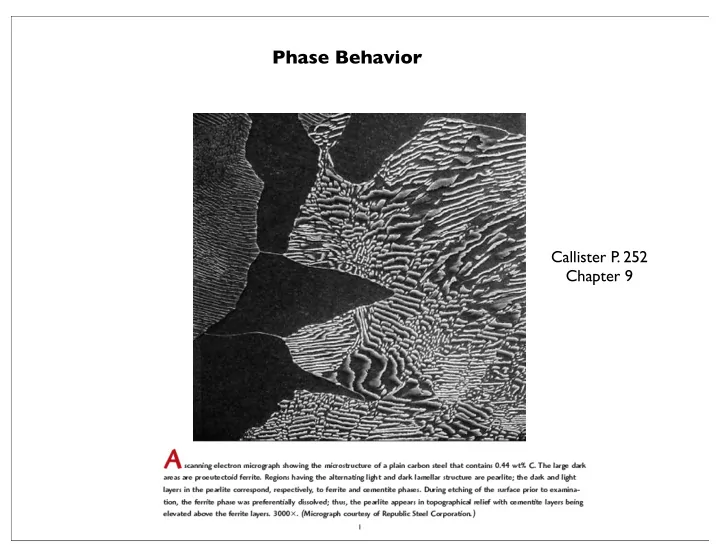
Phase Behavior Callister P . 252 Chapter 9 1 Chalcolithic Era - - PowerPoint PPT Presentation
Phase Behavior Callister P . 252 Chapter 9 1 Chalcolithic Era (7000 BC) (Copper Working) Bronze Age Copper and Arsenic (3000 BC) Ores from same site or Copper and Tin Alloys (2000 BC times vary around world) Coincident Ores in
1
2
3
4
5
6
7
8
9
10
11
12
13
14
15
16
17
18
19
20
21
22
23
24
25
26
27
28
29
30
31
32
33
34
35
36
37