
SLIDE 1
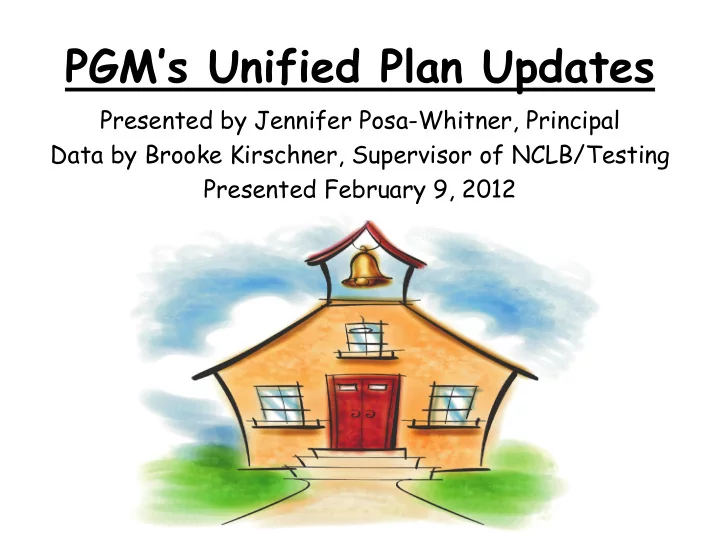
PGM’s Unified Plan Updates
Presented by Jennifer Posa-Whitner, Principal Data by Brooke Kirschner, Supervisor of NCLB/Testing Presented February 9, 2012
PGMs Unified Plan Updates Presented by Jennifer Posa-Whitner, - - PowerPoint PPT Presentation
PGMs Unified Plan Updates Presented by Jennifer Posa-Whitner, Principal Data by Brooke Kirschner, Supervisor of NCLB/Testing Presented February 9, 2012 PGMs Unified Plan Ensures that We Identify root causes and focus intervention
Presented by Jennifer Posa-Whitner, Principal Data by Brooke Kirschner, Supervisor of NCLB/Testing Presented February 9, 2012
intervention on those specific areas
based on the data to drive our targeted instruction for all levels of instruction
what we are doing is working
Because of This Laser Focus
Pine Grove Manor School 2011 vs. 2010 NJ ASK 3 LANGUAGE ARTS LITERACY
4
Pine Grove Manor School 2011 vs. 2010 NJ ASK 3 MATHEMATICS
5
Pine Grove Manor School 2011 vs. 2010 NJ ASK 4 LANGUAGE ARTS LITERACY
6
Pine Grove Manor School 2011 vs. 2010 NJ ASK 4 MATHEMATICS
7
Pine Grove Manor School 2011 vs. 2010 NJ ASK 4 SCIENCE
8
they read, asking themselves questions or making
for understanding.)
that they can read and understand not only at their independent level, but also when reading text above their independent level.
levels throughout the school year, but we still continue to have a gap in students that are reading at grade level.
Some Strategies We Use to Target Reading Comprehension
with accountable talk- Think Alouds
strategies in mini lesson and during small group
guided reading groups & during extended day
higher level thinking
independent use of comprehension strategies
Reading Incentive, Accountability & Follow Via: Monthly Reading Rally’s & Nightly Reading Logs, Principal Stunts as Added Incentives, Encouraging Announcements and Praise (Shout Outs)
– Analyze data during grade level meetings to identify students not meeting or approaching benchmark standardsprovide targeted/explicit instruction – Use of running records and anecdotal notes to drive instruction via walk throughs as well as during pre and post
– Target comprehension strategies such as segmenting text, asking questions as students read, making connections, rereading during read alouds, small group instruction and individual conferencing
Pine Grove Manor Grades 3 & 4 January LAL Focus Walk Teacher Name: _________________ Grade Level: _________
Reading Notebook -evidence of comprehension work (This is an area identified in our Unified
least 4 times per month
Sufficient Evidence Some Evidence Little Evidence Comments: Next steps:
Anchor charts that reflect reading comprehension strategies- (This is an area identified in our Unified Plan)
Sufficient Evidence Some Evidence Little Evidence Comments: Next steps:
Anecdotal Notes- Anecdotal notes must show a next step that is targeted and follow through
future lessons with that child.
Sufficient Evidence Some Evidence Little Evidence Comments: Next steps
Professional Development
– Provided by the Literacy Coach & TC Consultants on how to use the reader’s notebook and use
next step instruction – Analyzing Running records
along with meaning & structure when students come to a word they do not know
How Do We Monitor Progress at PGM?
in September, November, March & June (assess both comprehension and fluency)
differentiated guided reading and small group instruction
appropriate number of reading levels throughout the year (K:3 levels, Gr. 1:5 levels, Gr. 2-4:3 levels each)
PGM, Grade 1
* - Sp.E Last First High Spelling Running Writing #-ESL/B Name Name Frequency Inventory Record On Demand
Sept Nov Mar June Sept Mar Sept Oct Nov Dec
1 2 3 4 50 181
LN F
I 2 3
58
75
LN C
D 2 3
200
200
LN H
L 3 4
19
35
E B
C 1 2.5
14
40
E B
D 1 2
133
175
E E
H 2 3
174
200
LN I
L 3 4
149
200
WWP L
M 3 3.5
90
125
LN D
D 3 3.5
125
186
LN H
I 3 3.5
12
12
E B
B 2 2
68
121
LN D
F 2.5 3
149
200
LN I
L 2.5 3.5
142
175
E F
G 2 4
71
110
E D
F 2 3
40
76
E B
C 1 2.5
24
84
LN D
G 1 3.5
199
200
LN I
M 2.5 4
199
200
LN H
I 3 3.5
49
74
E C
E 2 3
78
128 LN
E
G 2 3
41
102 E B D 2 2.5 x 41 x x E x 3 *Lightfoot-Taylor: Enrolled 11/2/2011
Directions: 1). Type your name, school and grade in the top row. 2 ). In column A type an * (asterisk) for a Special Education Student and a # 1, #2, #3, or #4 for ESL/Bilingual students (indicating their level of ESL). Levels 1 and 2 ESL/BIL students’ names will be listed and coded on this Literacy Assessment spreadsheet by the mainstream teacher, but the data will be put on the ESL/BIL spreadsheet by the ESL/BIL teacher. Mainstream teachers will complete all information on the Literacy Assessment spreadsheet for Levels 3 and 4 ESL/BIL students. I F a student is neither classified as a special education student nor ESL/Bilingual, please leave the column blank. 3). Enter each student's first and last name in the next two columns. High Frequency Word Assessment is recorded as a cumulative score. Bold indicates months when Running Records must be done according to TC Benchmarks. Running Records are taken in September, November, March, and June for fourth grade students who are below or approaching benchmarks. Running records are taken in September, January and June for students who are meeting or exceeding grade level standards Additional Running Records may be done and recorded A sample is
DATA from September 2011 to November 2011
Grade 1 Grade 2 40% students moved up 1 level 48% students moved up 1 level 27% students moved up 2 levels 13% students moved up 2 levels 12% students moved up 3 levels 4% students moved up 3 levels 5% students moved up 4 levels 34% remained at the same level 16% remained at the same level TOTAL MOVEMENT 84% TOTAL MOVEMENT 65% Grade 3 Grade 4 38% students moved up 1 level 53% students moved up 1 level 13% students moved up 2 levels 7% students moved up 2 levels 5% students moved up 3 levels 2% students moved up 3 levels 44% remained at the same level 38% remained at the same level TOTAL MOVEMENT 56% TOTAL MOVEMENT 62% (New Benchmark coming in a month)
Attendance Initiative and get students excited about coming to school
awareness of the academic impact as well as inform parents of their child’s attendance
for students & families
families/students
attendance policy
importance of being at school
up with a plan of action to improve attendance
How Do We Monitor Progress at PGM?
Compare Monthly Attendance Data in 2011-2012 to Monthly Attendance Data in 2010-2011
WORK TOGETHER
month, meet with counselors and/
with plan of action to help the family/student improve attendance
Pine Grove Manor School Monthly Attendance UPDATE 2010-2011 vs. 2011-2012 School Year
24
Pine Grove Manor School Monthly Attendance 2010‐2011 vs. 2011‐2012 School Year
96.5% 95.8%
October
2010‐2011 2011‐2012 95.7% 94.9%
November
2010‐2011 2011‐2012 95.9% 94.5%
December
2010‐2011 2011‐2012 95.6% 92.3%
January
2010‐2011 2011 2012
correct answers to extended constructed response problems
their work AND explain their answer using words
Reading Connection
– Multi –Step word problems require:
the question (rereading for understanding)
know in order to apply that knowledge to solve problems
Explicitly Connect Reading Strategies Across Content Area of Math Via:
Expectation
Math groups & during Extended Day
feedback in their student math journals
– Analyze data during grade level meetings to identify students not meeting or approaching benchmark standardsprovide targeted/explicit instruction – Use benchmark assessments and anecdotal notes to drive instruction via walk throughs as well as during pre and post
– That target evidence of the implementation of comprehension strategies such as segmenting text, thinking about what the question is asking as students read, making connections & the importance of rereading in math
– Targeted small group/differentiated instruction, journal feedback to move students and use of anecdotal notes to drive targeted next step instruction – Provided by the Math Coach and Aussie consultants
How Do We Monitor Progress at PGM?
from benchmark assessments
year to drive explicit instruction
increase in rigor over the course of the school year. Teachers will score student work using a rubric
beginning of the year & end of the year assessment containing ECR problems in math, as well as progress monitor monthly in order to increase performance from September 2011 to June 2012
Presented by Eileen Brett, Principal Data by Brooke Kirschner, Supervisor of NCLB/Testing Presented February 9, 2012
grade level are within one school
upon early interventions
improvement and dig deeply to identify root causes
and adjust strategies for targeted areas
sure that what we are doing is working
Because of This Laser Focus
Sampson G. Smith School 2011 vs. 2010 NJ ASK 5 LANGUAGE ARTS LITERACY
35
Sampson G. Smith School 2011 vs. 2010 NJ ASK 5 MATHEMATICS
36
Sampson G. Smith School 2011 vs. 2010 NJ ASK 6 LANGUAGE ARTS LITERACY
37
Sampson G. Smith School 2011 vs. 2010 NJ ASK 6 MATHEMATICS
38
unable to answer comprehension questions related to the piece.
not able to extract meaning from the word.
thus unable to extract meaning from the entire paragraph and eventually the entire piece of writing.
able to establish comprehension.
Some Steps We Took to Target Vocabulary Instruction
Book Study Groups Building Robust Vocabulary What To Do About Struggling Readers Forming a Vocabulary PLC Further research of vocabulary strategies Creation of Vocabulary Toolkit Staff Development Whole Staff Commitment Vocabulary Word of the Day Pre and Post Assessments Vocabulary Competitions
– Analyze data during summer months to identify students not meeting or approaching benchmark standardsprovide targeted/explicit instruction. – Analyze data during summer months to identify patterns of weaknesses and strengths within individual classrooms.
– Each teacher receives the data on the students taught in the previous year for a study of strengths and weaknesses at a faculty meeting. – Each teacher receives the data on the students taught in the present year for a study of strengths and weaknesses at a faculty meeting. – Each teacher meets individually with one of the
– Each teacher meets individually with one of the building administrators to discuss a student they have identified to target. – The teacher with the administrator writes an action plan for that individual student.
How Do We Monitor Progress at SGS?
in September, November, March & June
differentiated guided reading and small group instruction
group and individualized instruction.
Behavior Plans appropriate for intermediate and middle school level.
teachers in the system found most appropriate.
foundations for positive classroom behaviors and procedures in all classrooms.
foundations for classroom behavior.
Harry Wong was not clear enough nor cohesive enough for schoolwide effectiveness.
support PBS schoolwide and was accepted for the grant.