
SLIDE 1
Railway Operations Research Seminar ‘Put Passengers First’ May 3, 2016, Leuven
Rob M.P. Goverde Department of Transport and Planning Delft University of Technology r.m.p.goverde@tudelft.nl
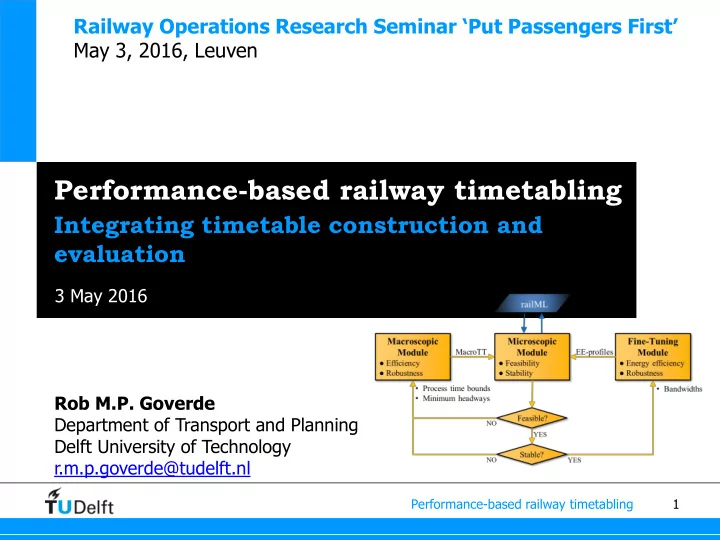
Performance-based railway timetabling
Performance-based railway timetabling
1