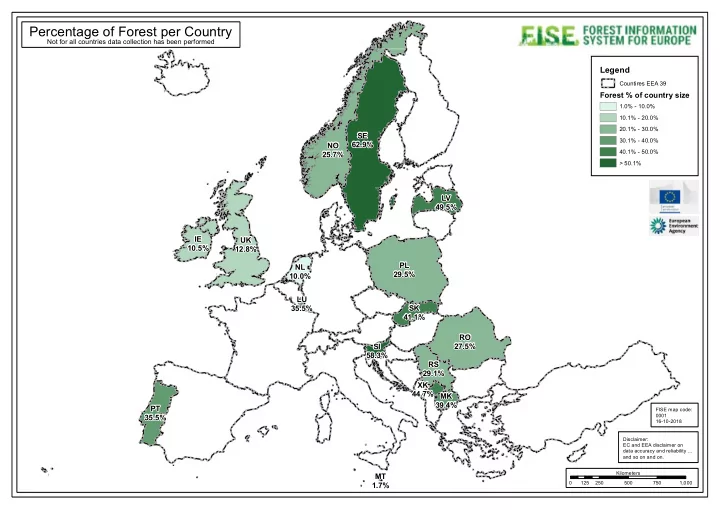
percentage of forest per country
play

Percentage of Forest per Country Not for all countries data - PowerPoint PPT Presentation

Percentage of Forest per Country Not for all countries data collection has been performed Legend Countires EEA 39 Forest % of country size 1.0% - 10.0% 10.1% - 20.0% 20.1% - 30.0% SE 30.1% - 40.0% 62.9% NO 40.1% - 50.0% 25.7% >


  1. Percentage of Forest per Country Not for all countries data collection has been performed Legend Countires EEA 39 Forest % of country size 1.0% - 10.0% 10.1% - 20.0% 20.1% - 30.0% SE 30.1% - 40.0% 62.9% NO 40.1% - 50.0% 25.7% > 50.1% LV 49.5% IE UK 10.5% 12.8% PL NL 29.5% 10.0% LU 35.5% SK 41.1% RO 27.5% SI 58.3% RS 29.1% XK 44.7% MK 39.4% PT FISE map code: 0001 35.5% 16-10-2018 Disclaimer: EC and EEA disclaimer on data accuracy and reliability ... and so on and on. Kilometers MT 0 125 250 500 750 1,000 1.7%

  2. Percentage of Forest at NUTS 2 level Not for all countries data collection has been performed Legend Countires EEA 39 59.1% Forest % at NUTS 2 level 1.7% - 10.0% 10.1% - 20.0% 20.1% - 30.0% 70.0% 30.1% - 40.0% 40.1% - 50.0% 74.6% 50.1% - 80.0% 53.0% 59.4% 51.1% 49.5% 65.7% 45.0% 36.6% 31.4% 36.3% 30.8% 23.4% 3.1% 3.2% 11.1% 4.8% 25.7% 49.2% 19.8% 28.1% 23.3% 21.3% 1.9% 14.9% 29.8% 28.3% 15.3% 31.9% 38.1% 28.7% 26.6% 35.5% 45.2% 52.1% 32.5% 25.6% 29.1% 37.0% 15.4% 32.9% 19.1% 14.7% 27.8% 44.7% 25.8% 39.4% 37.2% FISE map code: 0002 22.8% 16-10-2018 42.9% Disclaimer: EC and EEA disclaimer on data accuracy and reliability ... and so on and on. 40.3% Kilometers 1.7% 0 125 250 500 750 1,000

  3. Percentage of Forest at NUTS 3 level Not for all countries data collection has been performed Legend 54.3% Countires EEA 39 Forest % at NUTS 3 level 1.0% - 10.0% 67.7% 10.1% - 20.0% 20.1% - 30.0% 65.0% 81.7% 30.1% - 40.0% 82.0% 40.1% - 50.0% 75.4% 50.1% - 90.0% 62.9% 53.0% 66.9% 55.5% 63.9% 54.9% 50.3% 55.8% 53.8% 46.3% 62.7% 53.7% 39.9% 66.8% 44.2% 55.3% 74.6% 72.4% This map is not 37.7% a good solution to represents Forest % Figures at NUTS 3 level, 35.5% 49.4% 56.0% as the maps 11.4% 49.3% 39.6% 49.2% 17.9% 41.2% 51.2% 36.6% 16.4% 15.3% 40.8% cannot be read 24.6% 15.8% 27.8% 39.8% 32.8% 8.3% properly any 27.3% 32.6% 26.3% 12.4% 12.1% 44.8% 40.6% longer - a 5.5% 9.8% 4.3% 5.0% 30.1% 12.0% different presentation has 44.7% 43.2% to be chosen, 52.2% 31.8% 36.5% 29.2% 51.9% see next map. FISE map code: 0003 16-10-2018 Disclaimer: EC and EEA disclaimer on data accuracy and reliability ... and so on and on. Kilometers 1.9% 0 125 250 500 750 1,000

  4. Percentage of Forest at NUTS 3 level Sweden Not for all countries data collection has been performed Countries with NUTS 3 level Overview Map 54.3% Latvia Forest Area Information existing: FYROM, Kosovo, Latvia, 55.8% Luxembourg, Malta, Romania, Slovakia and Sweden. 53.8% 67.7% See detailed maps for % figures 39.9% 53.7% and spatial distribution of forest. 44.2% 65.0% 81.7% Kilometers 0 25 50 100 150 200 82.0% 75.4% 62.9% 61.2% Slovakia Sweden 53.0% 66.9% 63.9% 55.5% 49.4% 56.0% 55.8% 54.9% 50.3% 39.6% 53.8% 46.3% 62.7% 49.3% 53.7% 44.2% 66.8% 49.2% 55.3% 74.6% 72.4% 15.8% 36.6% 37.7% 15.3% Kilometers 16.4% Kilometers Kilometers 0 250 500 1,000 1,500 2,000 0 62.5 125 250 375 500 0 25 50 100 150 200 27.8% Romania Luxembourg Kosovo, FYROM Malta 39.6% 1.0% 11.4% 49.2% 51.2% 41.2% 17.9% 16.4% 44.7% 44.4% 35.9% 24.8% 13.7% 33.1% 1.9% 40.8% 24.6% 39.8% 27.8% 32.8% 43.2% 35.5% 43.8% 8.3% 36.5% 46.3% 37.3% 32.6% 31.8% 27.3% 38.3% 51.9% Kilometers 36.6% 12.4% 26.3% 44.8% 52.2% 5.9% 0 10 20 Forest coverage 12.1% 31.1% 29.2% 40.6% in % at NUTS 3 47.1% Kilometers Kilometers 29.4% 5.5% 49.4% 44.7% 4.3% 16.6% 0 25 50 0 50 100 1.0% - 12.4% 30.1% 9.8% 11.0% 12.5% - 20.0% 5.0% 12.0% 20.1% - 30.0% Legend overview map Kilometers 30.1% - 40.0% Countires EEA 39 0 50 100 200 300 400 Disclaimer: 40.1% - 50.0% Forest % at NUTS 3 level FISE map code: EC and EEA disclaimer on 50.1% - 90.0% 0004 data accuracy and reliability ... Forest % at NUTS 3 level 16-10-2018 and so on and on.

  5. COUNTRY NUTS FILE NOTES LEVEL Ireland 0, 1 Chapter 2_Area.xls tab 2.1.1 Kosovo 0, 1, 2, 3 2012_NFI-II_Table-04_Development of total area by land use classes.xlsx Latvia 0, 1, 2, 3 Statistics_DB/MS050_Forest Area by Tree type_by Region and District_2004-2008_2009_2014.xlsx Luxemburg 0, 1, 2, 3 a3402_Forest_Area_by_Region- ecologique_2000_2010.xls Macedonia 0, 1, 2, 3 ES321M16_ForestArea_NUTS3_Species_2010-2016.xlsx Malta 0, 1, 2, 3 Tree Protection Area_Area statistics_Planning Authority_Geoserver.xlsx Netherlands 0, 1, 2 NFI-6_Tabel_03.02_Area_by_ownership-and- province_I_translated.xlsx Norway 0, 1 ReportTable-09a_StatBank-06287_Area_Development- classes_by_Region-period_2013-2017_JRC.xlsx Poland 0, 1, 2 2016_NFI-III_Table-02_Version-02_Area- Species_Voivodeship.xlsx Portugal 0, 1, 2 Area_Forest-Status_1995-2005-2010_NUTS-0- 2_enhanced.xls Romania 0, 1, 2, 3 Statistics_Office/TEMPO_AGR301A_Standwisedata_1990- 2016_Nuts0-3_ForestTypes.xlsx Serbia 0 NFI_I_AREA_L0_RS_table_01_Landuse_classes.xlsx Slovakia 0, 1, 2, 3 SK_Area_ForestLand_ForestStands_Region_2010- 2016_JRC-value-added.xlsx Slovenia 0, 1 1673105E201811539827_Forest- Area_FReserves_FProtective.xls Sweden 0, 1, 2, 3 101 Tabell1.2_LandUseByLandUseClass_2005- 2014_Nuts2.xlsx UK 0 National_Forest_Inventory_Woodland_GB.csv National_Forest_Inventory_Woodland_Scotland.csv National_Forest_Inventory_Woodland_Wales.csv

Download Presentation
Download Policy: The content available on the website is offered to you 'AS IS' for your personal information and use only. It cannot be commercialized, licensed, or distributed on other websites without prior consent from the author. To download a presentation, simply click this link. If you encounter any difficulties during the download process, it's possible that the publisher has removed the file from their server.

Recommend


More recommend