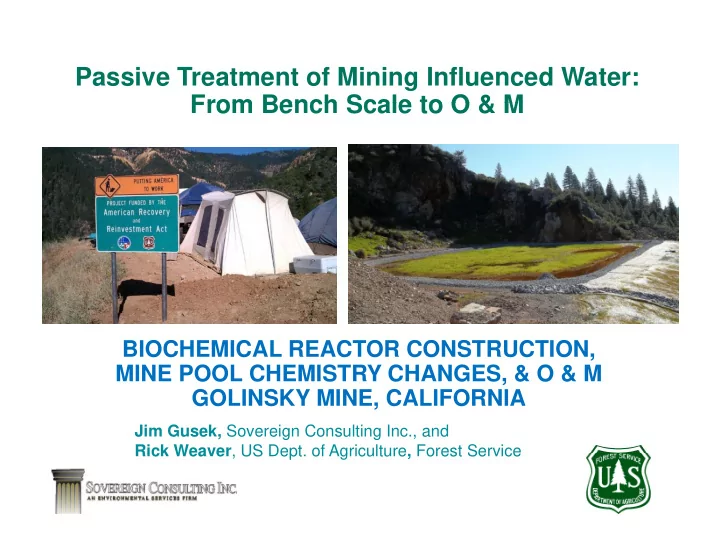
SLIDE 1 Passive Treatment of Mining Influenced Water: From Bench Scale to O & M From Bench Scale to O & M
BIOCHEMICAL REACTOR CONSTRUCTION, MINE POOL CHEMISTRY CHANGES, & O & M , GOLINSKY MINE, CALIFORNIA
Jim Gusek, Sovereign Consulting Inc., and Rick Weaver US Dept of Agriculture Forest Service Rick Weaver, US Dept. of Agriculture, Forest Service
SLIDE 2 Golinsky Mine, Trinity National Forest
I. BCR Design & Construction II. Mine Pool Improvements p
Maintenance Maintenance
SLIDE 3 Site Location & Project History
Site/Project History Site/Project History
Mine Operates 1904 to 1938 (copper & gold)
USFS acquires property in 1944 through purchase
2004 ‐ Bench Test Construction & Operation
2004 – Design/build buried pipeline
2004 – 2006 Pilot Scale Construction & Operation
2006 – Pilot decommissioning
2007 ‐ Full Scale Module 1 Design
2007 Full Scale Module 1 Design
2010 – Full Scale Construction
2011 – Full Scale Start‐up
2012 2016 Vi i it D ht
2012‐2016 Vicinity Drought
2016 – O&M Activity
SLIDE 4 Bench Test & Pilot Test Setup
4 Bench 4 Bench BCRs Modified Auto Sampler
Pilot Average Flow: 17 Weeks Bench Flow Range: Pilot Average Flow: 0.9 gpm 17 Weeks Bench Flow Range: 8.5 to 16.4 Liters/day
SLIDE 5
Mine Water Chemistry – Pilot Testing
Influent Water (Lower Portal) Pilot BCR Effluent (Lower Portal) pH – 2.7 Fe – 73 mg/L Effluent pH – 7.2 Fe – 0.8 mg/L Al – 23 mg/L Mn – 0.85 mg/L Al – 0.06 mg/L Mn – 2.5 mg/L Zn – 37 mg/L Cu – 12 mg/L Ni 0 031 /L Zn – 0.1 mg/L Cu – <0.003 mg/L Ni 0 007mg/L Ni – 0.031 mg/L Cd – 0.47mg/L SO – 664 mg/L Ni – 0.007mg/L Cd – 0.006 mg/L SO4– 488 mg/L SO4 664 mg/L SO4 488 mg/L
SLIDE 6 Passive Treatment Chemistry 101
SO4
‐2 + 2 CH2O HS‐ + 2HCO3 ‐ + H+
(Sulfate reduction and neutralization by bacteria) ( f y ) Zn+2 + HS‐ ZnS (s) + H+ (Sulfide precipitation)
REDUCING/ ANAEROBIC CONDITIONS
Fe+3 + 3 H2O Fe(OH)3 (s) + 3 H+ (Hydroxide precipitation)
OXIDIZING CONDITIONS
H+ + CaCO3 Ca+2 + HCO3
‐
(Limestone dissolution)
ALL CONDITIONS
(Limestone dissolution)
SLIDE 7 Module 1 Design Chemistry g y
Lower Portal E ti t f Lower Portal (Pilot f 27 Parameter Estimate for Design (2007 data) average for 27 months ‐ 2004 to 2006) Flow L/min 37 8 3 6 Flow, L/min 37.8 3.6 Flow, gpm 10 0.9 pH S.U. 3.0 2.7 F /L 27 73 Fe, mg/L 27 73 Cu, mg/L 14 12 Zn, mg/L 67 37 0 47 Cd, mg/L 0.73 0.47 Al, mg/L 31 23 Mn, mg/L 0.42 0.85 Sulfate mg/L <500 664
SLIDE 8
Mine, Pipeline, and Abandoned Limestone Quarry Limestone Quarry
SLIDE 9 Ph d M d l I l t ti Phased Module Implementation
- Portal flow data suggests peak of 90 gpm during
Portal flow data suggests peak of 90 gpm during wet months
- No available space at the mine site itself
- Available space at the quarry only has room for
30 gpm Sit i t i t d it’ diffi lt t b ild f ll
- Site access is restricted; it’s difficult to build full
PTS capacity in a single construction season
- Limited funding supports design of 10 gpm
Limited funding supports design of 10 gpm “starter” module and monitor to see if addition modules are necessary
SLIDE 10 Overall Design Philosophy g p y
- All flows by gravity
- Biochemical reactor sized for 10 gpm / 38 liters
minute
- Any by‐passed flow (>10 gpm) would be
neutralized by treated water in a mixing pond
- Mixing pond effluent would be infiltrated into
native ground in a “Flow Dispersion Zone”
- “Tweak” substrate recipe based on experience
at other sites
SLIDE 11
BCR Substrate Modification
Component Pilot BCR Full BCR Ri H ll 10% 10% Rice Hulls 10% 10% Wood Chips 40% 50% Hay 10% 10% Limestone 30% 30% Limestone 30% 30% Manure1 10% <0.1%
Manure (and 6 cy of depleted pilot substrate) rototilled into upper 12 inches of substrate
SLIDE 12 Construction Challenges
- Lake levels are the lowest in
years due to drought
G d bili ti it
- Good news: mobilization site
close to Shasta Dam (2.4 miles from beach head)
- Bad news: off‐loading barges will
b diffi l l i h be difficult on sloping shore at beach head
- Drought ends from El Nina rains
as bid walk is conducted as bid walk is conducted (March 2010)
- Lake levels rise, and rise, and
rise some more rise some more…
- Preferred mobilization site is
submerged; alternate site is 6.9 miles from beach head miles from beach head
SLIDE 13
Lake level recovery: too much of a good thing
Final Contractor Mobilization Site (6.9 miles) Mine (6.9 miles) Beach head Quarry Dam Initial Contractor Mobilization Site (2.4 miles)
SLIDE 14 Construction Challenges (Continued)
- Storing materials at a very constricted site
SLIDE 15 Construction Challenges (Continued)
- Ground conditions in one corner of the quarry
require field modification
BCR Footprint reduced by 3.6%
SLIDE 16 Construction Challenges (Continued) g ( )
- Delayed start due to weather and storm water BMP’s
puts project behind schedule and reduced available puts project behind schedule and reduced available construction budget
- Ground conditions in the mixing pond footprint spook
Ground conditions in the mixing pond footprint spook contractor
- Mixing pond is dropped from the contractor’s work
scope (see paper [Gusek, 2011] for details)
- Flow Dispersion Zone design is modified to minimize
d imported riprap
SLIDE 17 Golinsky BCR Construction, 2010 (with ARRA Funding)
Construction Cost: $1.3 million (about $0.012 per gallon for 20-yr life)
SLIDE 18
Final BCR As Built (January, 2011)
SLIDE 19 BCR Module 1 Commissioning Challenges Challenges
- Portal 3 is the only mine pool plumbed into the quarry
when the BCR is ready for commissioning (we used it for soil moisture dust control) moisture, dust control)
- Portal 3 sulfate concentration is only 8 to 10 mg/L
- Lower Portal pipeline is plugged with iron precipitates;
- Inclement weather prevented LP maintenance and the BCR
filled with rain water Solutions Solutions
Added 20 lbs or 9.1 kg of Epsom salt to BCR inflow Added a 30 lbs or 13.4 kg “teabag” of agricultural Added a 30 lbs or 13.4 kg teabag of agricultural
gypsum to flow distribution vault
Influent sulfate 14 mg/L; effluent 4 mg/L Lower Portal plumbed in January 25th 2011, no
“transition” (sulfate @1,127 mg/L; pH 2.7)
SLIDE 20
BCR Receiving Lower Portal MIW (May 2011) ( y )
SLIDE 21 BCR Receiving Lower Portal MIW (October 12, 2016) ( , )
Intruding Willows Removed Intruding Willows Removed
SLIDE 22
BCR Results (6 Lower Portal MIW events) ( )
Parameter Influent Effluent pH 2.7 s.u. 6.45 s.u. Iron 97.2 mg/L 6.1 mg/L Aluminum 28.6 mg/L 0.03 mg/L Copper 19.3 mg/L 0.005 mg/L Zinc 40.0 mg/L 0.5 mg/L / / Cadmium 0.40 mg/L 0.005 mg/L Calcium 19 mg/L 206 mg/L Manganese 0 6 /L 2 1 /L Manganese 0.6 mg/L 2.1 mg/L Sulfate 728 mg/L 324 mg/L ORP 354 mv ‐217 mv ORP 354 mv ‐217 mv 97% metal removal efficiency in May 2011
SLIDE 23
PART II PORTAL 3 MINE POOL IMPROVEMENTS IMPROVEMENTS
SLIDE 24
Full Scale Passive System Schematic Layout
SLIDE 25
Portal 3 and Lower/Upper Portal Proximity
Portal 3 Portal 3
?
Upper Portal ? Drainage Swale Lower Portal ?
?
Portal Little Backbone Creek
SLIDE 26
Changes in Portal 3 Chemistry 2004-2016 L P t l Mi P l 2004 Lower Portal Mine Pool Drain-down begins
SLIDE 27
Changes in Portal 3 Chemistry 2004-2016 2005
SLIDE 28
Changes in Portal 3 Chemistry 2004-2016 2006
SLIDE 29
Changes in Portal 3 Chemistry 2004-2016 2007 2007
SLIDE 30
Changes in Portal 3 Chemistry 2004-2016 2009
SLIDE 31
Changes in Portal 3 Chemistry 2004-2016 October 12, 2016 2016
SLIDE 32 Portal 3 Water Chemistry Improvements
0.07 to 0.11 gpm of Lower Portal MIW satisfies metal load in Portal 3 based on sulfate, zinc, and copper
SLIDE 33 Final Thoughts (Parts I & II) g ( )
- Construction Cost: $1.3 million – ARRA funding
with supplementary USFS funds
- Seven year span from initial bench tests in late
2003 to startup in late 2010 – fully commissioned in June 2011 in June 2011
- Safety record exemplary for remote site, heat
stress multiple water crossings stress, multiple water crossings
- After five years, system appears to be performing
as intended – no surprises (yet) p y
- No ill effects due to prolonged drought
SLIDE 34
PART III OPERATION & MAINTENANCE OPERATION & MAINTENANCE
SLIDE 35
BCR Commissioned in June 2011 & function as designed through 2012 2012
SLIDE 36
In 2012 following dry season, flow data logger flow data logger malfunctioning at BCR
SLIDE 37
Equipment mobilized to site q p with Landing Craft
SLIDE 38
Influence of vegetation potentially adversely affecting p y y g iron removal
SLIDE 39
Mini excavator used to pull p willows
SLIDE 40
Mini excavator moving vegetation removed from BCR vegetation removed from BCR
SLIDE 41
BCR after willow removal BCR after willow removal
SLIDE 42
Repairing BMPs on access road using hand tools and mini using hand tools and mini excavator
SLIDE 43
Clearing access road of g vegetation
SLIDE 44
Pipelines from Lower adit. Iron hydroxide sludge Iron hydroxide sludge blockage
SLIDE 45
Upper Adit Link Seal and Stainless Steel Link Seal and Stainless Steel Flexible Coupling installed to repair leak & stabilize pipe at bulkhead leak & stabilize pipe at bulkhead
SLIDE 46
Leak at Saddle Tee on Upper Adit Pipe p Repairing Saddle Tee with Romax Clamp Clamp
SLIDE 47
Trash bag stuck in pipe causing g p p g plug
SLIDE 48
Lower Adit Bat Gate Sock Filter over Floor Drain
SLIDE 49
Winter to summer flow rate decrease from 4.5 gpm to 1.5 gpm between April 25 and June 6, 2016. g Estimated cumulative total of 233,000 gallons received by the BCR.
SLIDE 50
Changing battery in data logger at BCR influent flume. Flow was BCR influent flume. Flow was 0.75 GPM on 10/12/16
SLIDE 51
Pipes replaced due to excessive p p iron hydroxide deposition
SLIDE 52
BCR at low water level on October 16, 2016 at end of dry summer
SLIDE 53
BCR on October 19, 2016 after 4 to 5 inches of rain in four days y
SLIDE 54
Mass Removal Rates from Spring Monitoring
SLIDE 55 Conclusion of Spring Monitoring Report
- Monitoring observations and data collected by ECM have
Monitoring observations and data collected by ECM have concluded that the BCR is operating within design parameters and is effectively removing metals from mine impacted water impacted water.
- The BCR appears to be treating the mine drainage
successfully and the efficiency of removal for aluminum, cadmium, and copper is close to 100%, with zinc near 83% removed. 83% removed.
SLIDE 56 Are the exposure assumptions, toxicity data, cleanup levels, Removal Action Objectives used at the time of the removal action (RA) still valid?
- Reduce or eliminate the release of acidity and heavy metals from
y y the Site to surface water and meet ARARs,
- Reduce or eliminate the release of acidity and heavy metals to
from the Site to groundwater and meet ARARs, and
- Reduce or eliminate the potential for exposure to humans,
ti d t t i l bi t f i ti di t t t ith aquatic and terrestrial biota from ingestion or direct contact with AMD and potentially contaminated aquatic life.
Data indicate that the BCR is effective at treating MIW at Data indicate that the BCR is effective at treating MIW at the design flow rate of 10 gpm. The exposure assumptions, toxicity data, cleanup levels, and RAOs used at the time of the RA are still valid & the BCR system that was installed is the RA are still valid & the BCR system that was installed is protective.
SLIDE 57 Storm water runoff in swale
- nly MIW discharged from site
SLIDE 58 Final Thoughts g
- Phased design approach minimizes risk
- Bulkheading underground mine workings is
g g g not always a good idea (ARD is going to find its way out)
- Passive treatment is LOW maintenance
Passive treatment is LOW maintenance, not NO maintenance
- Removal Action assumptions still valid; BCR
t i t ti system is protective
- Special thanks to:
- Brad Shipley (ret.), USFS P.O. 2003? to 2016,
Brad Shipley (ret.), USFS P.O. 2003? to 2016, and
- ECM Consultants, the current site monitoring
and O & M contractor
SLIDE 59
Questions/Discussion??