
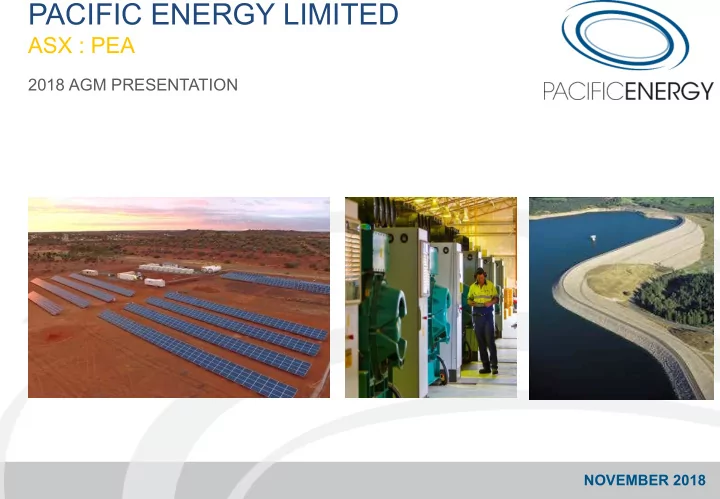
SLIDE 1
PACIFIC ENERGY LIMITED
ASX : PEA
2018 AGM PRESENTATION
NOVEMBER 2018
PACIFIC ENERGY LIMITED ASX : PEA 2018 AGM PRESENTATION NOVEMBER - - PowerPoint PPT Presentation
PACIFIC ENERGY LIMITED ASX : PEA 2018 AGM PRESENTATION NOVEMBER 2018 Pacific Energy Limited Annual General Meeting 2018 CHAIRMANS ADDRESS MR CLIFF LAWRENSON 2 Pacific Energy Limited Annual General Meeting 2018 Item 1: Annual
2018 AGM PRESENTATION
NOVEMBER 2018
2
Item 1: Annual Report
To consider the Annual Report of the Company and its controlled entities for the year ended 30 June 2018, which includes the Financial Report, the Directors’ Report and the Auditor’s Report.
3
Item 2 - Resolution 1: Adoption of Remuneration Report Proxies Received:
To consider and, if thought fit, to pass with or without amendment, as an ordinary resolution the following: "That, pursuant to and in accordance with section 250R(2) of the Corporations Act and for all other purposes, approval is given by the Shareholders for the adoption of the Remuneration Report on the terms and conditions in the Explanatory Memorandum."
For Against Open Abstain Excluded Votes 87,482,098 4,393,409 212,077,020 Percentage % 28.78% 1.45% N/A 69.77% N/A
4
Item 3 - Resolution 2: Re-election of Director – Mr Kenneth Joseph Hall Proxies Received:
To consider and, if thought fit, to pass with or without amendment, as an ordinary resolution the following: "That, pursuant to and in accordance with, article 17.1 of the Constitution and for all other purposes, Mr Kenneth Joseph Hall, Director, retires and being eligible, is re-elected as a Director on the terms and conditions in the Explanatory Memorandum."
For Against Open Abstain Excluded Votes 302,512,416 1,440,111 Percentage % 99.53% 0.47% N/A N/A N/A
5
Item 4 - Resolution 3: Issue of Performance Rights to Mr Brady Hall Proxies Received:
To consider and, if thought fit, to pass the following resolution as an ordinary resolution with or without amendment: "That, pursuant to and in accordance with Listing Rule 10.14 and for all other purposes, Shareholders approve the issue of 29,448 Performance Rights to Mr Brady Hall (and/or his nominee) under the Performance Rights Plan
For Against Open Abstain Excluded Votes 301,963,041 104,558 1,884,928 Percentage % 99.35% 0.03% N/A 0.62% N/A
6
7
This presentation has been prepared by Pacific Energy Limited (PEA) for information purposes only. This presentation is not a product disclosure statement or prospectus for the purposes of the Australian Corporations Act 2001 (Cth), nor does it constitute financial product or investment advice or a recommendation, offer or invitation by any person or to any person to sell, purchase or otherwise invest in securities in PEA in any jurisdiction. Neither this presentation nor anything in it shall form the basis of any contract or commitment. This presentation contains general information only and does not take into account the investment objectives, financial situation and particular needs of individual investors. Investors should make their own independent assessment of the information in this presentation and obtain their own independent advice from a qualified financial adviser, lawyer, accountant, tax
The information in this presentation includes historic information about the performance of PEA and securities in PEA. That information is historic only, and is not an indication or representation about the future performance of PEA or securities in PEA. You should not place undue reliance on any such information. No representation or warranty, express or implied, is given as to the accuracy, completeness, reliability or adequacy of any statements, estimates, opinions or other information, or the reasonableness of any assumption or other statement, contained in this presentation. Nor is any representation or warranty, express or implied, given as to the accuracy, completeness, likelihood of achievement or reasonableness of any forecasts, forward-looking statements or potential returns contained in this presentation. Forward-looking statements include, but are not limited to, information which reflects management’s expectations regarding PEA's future growth, results of operations (including, without limitation, capital expenditures), performance (both operational and financial) and business prospects and opportunities. Often, forward-looking statements include words such as “plans”, “expects” or “does not expect”, “is expected”, “budget”, “scheduled”, “estimates”, “forecasts”, “intends”, “anticipates” or “does not anticipate” or “believes” or variations of such words and phrases or statements that certain actions, events or results “may”, “could”, “would”, “might” or “will” be taken, occur or be achieved. Forecasts, forward-looking statements or potential returns only reflect subjective views held by PEA, and are based on certain assumptions made by PEA, as at the date specified in the relevant information and are by their nature subject to significant uncertainties and contingencies, many of which are outside the control of PEA. Although management believes that the assumptions made and the expectations represented by such information are reasonable, there can be no assurance that forward-looking statements will prove to be accurate. Actual events and results may vary from the events or results expressed or implied in such statements. Given these uncertainties, you should not place undue reliance on any such statements Subject to any continuing obligations under applicable law or any stock exchange listing rules, in providing the information in this presentation, PEA des not undertake any obligation to publicly update or revise any forward-looking statements or to advise of any change in events, conditions or circumstances on which any such statement is based. To the maximum extent permitted by law, PEA and its related bodies corporate, directors, officers, employees, advisers and agents disclaim all liability and responsibility (including without limitation any liability arising in negligence, statute or otherwise) for any direct or indirect loss or damage which may arise or be suffered by any person through use or reliance
control of PEA. PEA does not guarantee any particular rate of return or the performance of PEA securities. The distribution of this presentation including in jurisdictions outside Australia, may be restricted by law. Any person who receives this presentation must seek advice on and observe any such restrictions.
8
9
10% ahead of FY17
dilution to shareholders
from 278MW to almost 400MW (40+% increase)
stations
10
Growing portfolio of long-term assets generating power and cash
Long term contracts provide cash flow visibility
Demonstrated resilience plus growth through the cycles Utility style income
Summary Financials
$000’s FY18 FY17
Revenue 68,769 58,028 Underlying EBITDA (44,105) (40,019) Due Diligence / Acquisition Costs (4,789)
(9,766)
1,725
Reported EBITDA 31,275 40,835 Depreciation and Amortisation (18,810) (15,695) Net Financing Expenses (2,559) (1,636) Profit before Tax 9,906 23,504 Income Tax Expense (3,125) (6,903) Reported NPAT 6,781 16,601 Underlying NPAT 18,341 16,030
11
underlying revenue was up 9%
acquisition (awaiting assessment)
acquisitions (two were completed)
2018 $m’s 2017 $m’s
Cash 12.1 5.0 Receivables 16.4 6.3 PP&E 224.0 160.0 Intangibles 55.3 24.1 Other 8.3 1.4 TOTAL ASSETS 316.1 196.8 Current liabilities (ex debt) 22.3 6.3 Current debt 11.8 6.9 Non current debt 95.2 25.9 Deferred tax 12.4 11.5 Other 2.9 1.1 TOTAL LIABILITIES 144.6 51.7 NET ASSETS 171.5 145.1 NET TANGIBLE ASSETS 116.3 121.0
12
$98m
$21m
$95m
$140m
14x
$22m
$22m
business as usual activities
Key Terms
Pricing
Hedging
Recommencement of Dividends
13
GEARING 31 Oct 2018 30 June 2018 30 June 2017 Net Debt: Net Assets 46.0% 55.0% 19.2% Net Debt: NTA 66.1% 82.0% 22.9% Net Debt: EV 25.9% 28.2% 9.1%
14
thermal baseload power and evolving renewable energy technologies
52MW Reciprocating Gas Engine Power Station Under Construction
Forecast FY19 Revenue
End User Markets Gold Copper Lithium Mineral Sands Manganese Townships NEM
15
average remaining contract duration approximately 4 years provides strong earnings visibility
90% of revenue from clients with All In Sustaining Cost Margin exceeding 30%
MW by Fuel Type
and operating hybrid technology
Client Site Industry FY18 FY19 FY20 FY21 FY22 FY23 FY24 Current Mine Life * AngloGold Ashanti Tropicana Gold Contracted to 2028 2028 Pilbara Minerals Pilgangoora Lithium Contracted to 2025 2053 St Barbara Gwalia Gold Contracted to 2024 2024 Horizon Power MidWest Townships Contracted to 2025 Indefinite Panoramic Resources Savannah Nickel Contracted to 2027 2027 Galaxy Resources Mt Cattlin Lithium/Tantalum Contracted to 2022 2028 Saracen Carosue Dam Gold Contracted to 2023 2024 Saracen Thunderbox Gold Contracted to 2021 2025 Regis Garden Well Gold Contracted to 2023 2025 Energy Australia Cardinia NEM Contracted to 2023 Indefinite Iluka Jacinth Ambrosia Mineral Sands Contracted to 2021 2027 Sandfire DeGrussa Copper/Gold Contracted to 2022 2022 Altura Pilgangoora Lithium Contracted to 2023 2031 Westgold Fortnum Gold Contracted to 2022 2022 Doray Deflector Copper/Gold Contracted to 2021 2021
16
*PEA estimate
Contracts have options to extend and typically roll into new terms and as mine lives extend
to be awarded, subject to negotiation of PPA terms and conditions
awards taking longer than expected
17
and visibility
50% through 24MW of new capacity in first four months of FY19)
record
18 Existing Customers
increasing power generation over time
new projects
expansion and mine re-start
New Mining Projects
approximately 20 new projects all at various stages
in formal tenders
projects in formal study stages
frontier, albeit slower than expected New Opportunities
recent acquisitions
asset acquisition opportunities
Growth Drivers:
19