
SLIDE 1
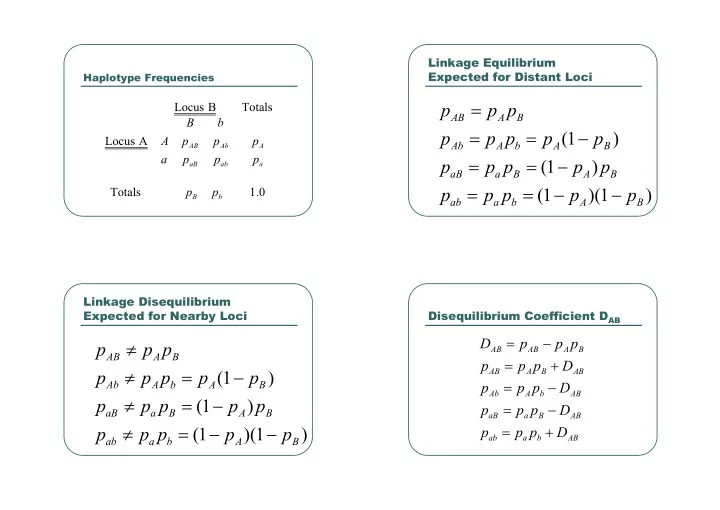
Haplotype Frequencies
. 1 Totals A Locus Totals B Locus
b B a A ab aB Ab AB
p p p p p p a p p A b B
Linkage Equilibrium Expected for Distant Loci
) 1 )( 1 ( ) 1 ( ) 1 (
B A b a ab B A B a aB B A b A Ab B A AB
p p p p p p p p p p p p p p p p p p
- Linkage Disequilibrium
Expected for Nearby Loci
) 1 )( 1 ( ) 1 ( ) 1 (
B A b a ab B A B a aB B A b A Ab B A AB
p p p p p p p p p p p p p p p p p p
- Disequilibrium Coefficient DAB
AB b a ab AB B a aB AB b A Ab AB B A AB B A AB AB