
SLIDE 1
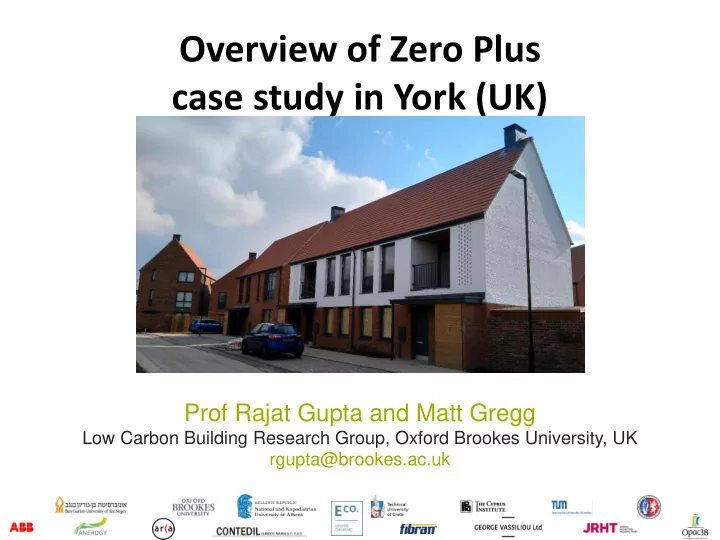
Overview of Zero Plus case study in York (UK)
Prof Rajat Gupta and Matt Gregg
Low Carbon Building Research Group, Oxford Brookes University, UK rgupta@brookes.ac.uk
Overview of Zero Plus case study in York (UK) Prof Rajat Gupta and - - PowerPoint PPT Presentation
Overview of Zero Plus case study in York (UK) Prof Rajat Gupta and Matt Gregg Low Carbon Building Research Group, Oxford Brookes University, UK rgupta@brookes.ac.uk Outline 1. Introduction to the UK case study 2. Summary of installed
Low Carbon Building Research Group, Oxford Brookes University, UK rgupta@brookes.ac.uk
Technologies Categories Advanced Envelope HVAC BEMS Energy Production Technologies Thermal Energy Storage Integrated Energy Resources Management UK N/A N/A HIVE BEMS installed (learning thermostat & energy management Typical PV system installed across four dwellings to achieve settlement level aggregated generation N/A Tesla Powerwall II batteries installed in each dwelling to manage electricity demand from PV and off-peak reduced rate charging
Tesla Powerwall 2 Battery Outside house Tesla Gateway (communication) Inside house
HIVE Learning Thermostat HIVE Energy Management technologies pre install:
HIVE motion sensor HIVE active plug
Door sensor Window sensor
14.0°C 24.0°C 15 20 A R01 A R03* A R02