
SLIDE 1
1
District of Columbia Water and Sewer Authority
Overview of Proposed FY 2021 and FY 2022 Rates, Charges and Fees
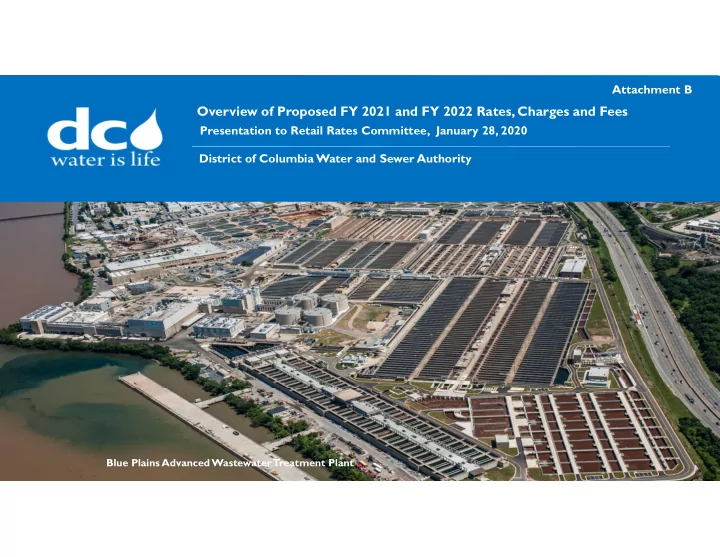
Blue Plains Advanced Wastewater Treatment Plant
Presentation to Retail Rates Committee, January 28, 2020 Attachment B
Overview of Proposed FY 2021 and FY 2022 Rates, Charges and Fees - - PowerPoint PPT Presentation
Attachment B Overview of Proposed FY 2021 and FY 2022 Rates, Charges and Fees Presentation to Retail Rates Committee, January 28, 2020 District of Columbia Water and Sewer Authority Blue Plains Advanced Wastewater Treatment Plant 1 Purpose
1
District of Columbia Water and Sewer Authority
Overview of Proposed FY 2021 and FY 2022 Rates, Charges and Fees
Blue Plains Advanced Wastewater Treatment Plant
Presentation to Retail Rates Committee, January 28, 2020 Attachment B
Provide information to the Committee on the: Multi-year Rate Proposal
FY 2020 – FY 2029 Financial Plan
2
Resolution #11-10
It is the policy of the Board of Directors of DC Water in setting retail rates, including charges and fees, pursuant to its statutory authority to strive to achieve the following:
well as goals set by the Board
designed
T
mitigate future customer impacts and annual rate increases, including transferring excess funds to the Rate Stabilization Fund
3
Cost of Service Study advanced to align with rate proposal Combined rate increase for average household customer lowered from 8.1% forecasted last year to 6.6% for FY 2021 and from 6.9% to 6.7% for FY 2022
FY 2022
4
5
Residential $130,803 17.8% Commercial $180,589 24.6% Multi-Family $110,241 15.0% Federal Government $77,571 10.6% Municipal & Housing $30,318 4.1% Rate Stabilization Fund $2,500 0.3% Water System Replacement Fee $39,717 5.4% Metering Fee $15,405 2.1% Wholesale $81,986 11.2% Other Revenue $64,608 8.8%
Sources - $733.7 Million Uses - $733.7 Million
Personnel Services $153,482 20.9% Contractual Services $88,532 12.1% Water Purchases $36,250 4.9% Chemicals and Supplies $36,081 4.9% Utilities $27,911 3.8% Small Equipment $1,030 0.1% Debt Service $222,268 30.3% Cash Financed Capital Improvements $30,355 4.1% PILOT $17,272 2.4% ROW $5,100 0.7% Pay-Go,
$115,457 15.7%
$ in thousands
Approved FY 2020 $693,979 Proposed FY 2021 $733,738
Residential $124,353 17.9% Commercial $173,826 25.0% Multi-family $100,884 14.5% Federal Government $71,887 10.4% Municipal Housing $28,110 4.1% Water System Replacement Fee $39,717 5.7% Metering Fee $10,776 1.6% Wholesale $82,539 11.9% Other Revenue $61,887 9.1%
$ in thousands
Residential $130,803 17.8% Commercial $180,589 24.6% Multi-Family $110,241 15.0% Federal Government $77,571 10.6% Municipal & Housing $30,318 4.1% Rate Stabilization Fund $2,500 0.3% Water System Replacement Fee $39,717 5.4% Metering Fee $15,405 2.1% Wholesale $81,986 11.2% Other Revenue $64,608 8.8%
6
The current residential use in FY 2019 is about 5.42 Ccfs, less than the 6.20 Ccfs that DC Water has used since FY 2014 Since FY 2009, average household water use has declined by 19 percent
7
Average Residential Customer Monthly bill based on 5.42 Ccf, or 4,054 gallons
Gives most households a year over year representation of their water bill:
8
` Units Current FY 2020 Proposed FY 2021 Proposed FY 2022 DC Water Water and Sewer Retail Rates (1) Ccf 66.25 $ 73.30 $ 78.92 $ DC Water Clean Rivers IAC (2) ERU 20.94 19.52 18.40 DC Water Customer Metering Fee 5/8" 3.86 4.96 7.75 DC Water Water System Replacement Fee (4) 5/8" 6.30 6.30 6.30 Subtotal DC Water Rates & Charges 97.35 $ 104.08 $ 111.37 $ Increase / Decrease 5.01 $ 6.73 $ 7.29 $ District of Columbia PILOT Fee (1) Ccf 2.76 $ 2.93 $ 3.04 $ District of Columbia Right-of-Way Fee (1) Ccf 1.03 1.03 1.03 District of Columbia Stormwater Fee (3) ERU 2.67 2.67 2.67 Subtotal District of Columbia Charges 6.46 $ 6.63 $ 6.74 $ Total Amount Appearing on DC Water Bill 103.81 $ 110.71 $ 118.11 $ Increase / Decrease Over Prior Year 5.11 $ 6.90 $ 7.40 $ Percent Increase in Total Bill 5.2% 6.6% 6.7%
(1) Assumes average monthly consumption of 5.42 Ccf, or (4,054 gallons) (2) Assumes average 1 Equivalent Residential Unit (ERU) (3) District Department of the Environment stormwater fee of $2.67 effective November 1, 2010 (4) DC Water "Water System Replacement Fee" of $6.30 for 5/8" meter size effective October 1, 2015 9
Proposed rates are for FY 2021 and FY 2022 Multi-year rates provide many benefits:
Potential risks / considerations:
10
8.4% 5.8% 9.2% 12.2% 3.4% 4.1% 3.4% 5.2% 8.1% 6.9% 7.3% 8.3% 3.5% 4.5% 4.5% 5.6% 5.2% 6.6% 6.7% 6.7% 8.8% 4.4% 5.7% 5.8% 6.1% 6.2% 0.0% 2.0% 4.0% 6.0% 8.0% 10.0% 12.0% 14.0%
FY 2013 FY 2014 FY 2015 FY 2016 FY 2017 FY 2018 FY 2019 FY 2020 FY 2021 FY 2022 FY 2023 FY 2024 FY 2025 FY 2026 FY 2027 FY 2028 FY 2029
Historical Last Year's Financial Plan (FY 2019 - FY 2028) FY 2021 Proposed Financial Plan (FY 2020 - FY 2029)
Residential Bill Increase 11
withdrawal from Rate Stabilization Fund to be deposited in FY 2020
reduction in Rate Stabilization Fund balance as the Board drew funds to reduce the impact of rising rates
12
In FY 2019, the Metering Fee recovered $11.6 million
(AMI) system and meter purchase and installation (debt service) plus about $4 million of Customer Service costs
Current Cost of Service Study recommends recovering $24.1 million in FY 2022, consistent with independent rate review recommendation
full Customer Service O&M allocation ($4.96 for a 5/8” meter)
$24.1 million ($7.75 for a 5/8” meter)
13
* Assumes average residential consumption of 5.42 Ccf, or 4,054 gallons, per month. Ccf = hundred cubic feet, or 748 gallons Reflects rates and fees in place as of November 1, 2019
To be updated
14
Units Approved FY 2020 Proposed FY 2021 Proposed FY 2022
FY 2021
FY 2022 $ % $ % DC Water Retail Rates –Water: Residential – Lifeline (0- 4 Ccf) Residential – (> 4 Ccf) Multi-family Non-Residential Ccf Ccf Ccf Ccf $3.06 4.10 3.54 4.25 $3.49 4.50 3.96 4.65 $3.63 4.74 4.15 4.91 $0.43 14.1% $0.14 4.0% 0.40 9.8 0.24 5.3 0.42 11.9 0.19 4.8 0.40 9.4 0.26 5.6 DC Water Retail Rates – Sewer Ccf 8.89 9.77 10.64 0.88 9.9 0.87 8.9 DC Water Clean Rivers IAC ERU 20.94 19.52 18.40
DC Water Customer Metering Fee 5/8” 3.86 4.96 7.75 1.10 28.5 2.79 56.3 DC Water System Replacement Fee 5/8” 6.30 6.30 6.30
Ccf 0.51 0.54 0.56 0.03 5.9 0.02 3.7 District of Columbia Right of Way Fee Ccf 0.19 0.19 0.19
ERU 2.67 2.67 2.67
T
mainly due to rate increases Retail revenue is projected to increase by $35.1 million or 6.4% for FY 2021 and $23.0 million or 3.9% for FY 2022 due to rate increases for both years Wholesale revenue is projected to decrease by $0.6 million or -0.7% for FY 2021due to low flows and increase by $2.5 million or 3.0% for FY 2022 due to 3.0 percent escalation
Approved Proposed Proposed FY 2021 vs FY 2020 FY 2022 vs FY 2021 FY 2020 FY 2021 FY 2022 Incr/(Decr) Incr/(Decr) $ % $ % Retail Revenue $549,553 $584,644 $607,652 $35,091 6.4% $23,008 3.9% Wholesale Revenue Potomac Interceptor (PI) 2,715 3,547 3,547 832 30.6%
7,758 7,648 7,983
335 4.4% Washington Suburban Sanitary Commission (WSSC) 57,284 55,952 57,630
1,678 3.0% Fairfax County 14,782 14,839 15,285 57 0.4% 446 3.0% Total Wholesale Revenue $82,539 $81,986 $84,445
$2,459 3.0% Other Revenue 61,887 64,608 63,701 2,721 4.4%
Rate Stabilization Fund
10,500 2,500
320.0% Total Revenues $693,979 $733,738 $766,298 $39,759 5.7% $32,560 4.4%
$ in thousands
16
(with 50 percent CRIAC Discount for CAP)
17
Independent rate review identified that households in CAP program pay greater percentage of household income for water and sewer bills than the newer CAP expansion programs
CAP Thresholds State Median Income $105,173 Area Median Income1 $121,300 Projected FY2021 Projected FY2021 Projected FY2021 CAP - Up to 60% SMI 20% $21,035 6.32% 2.21% $864.24 30% 31,552 4.21% 1.47% 864.24 40% 42,069 3.16% 1.10% 864.24 50% 52,587 2.53% 0.88% 864.24 60% 63,104 2.11% 0.74% 864.24 CAP2 - Up to 80% AMI 80% $97,040 1.37% 0.76% $594.48 CAP3 - Up to 100% AMI 100% $121,300 1.10% 0.95% $175.68 Notes: 1 - AMI based on 2019 data as published by the U.S. Department of Housing and Urban Development. Annual Bill as % of Income (before Discount) Annual Bill as % of Income (w Discount) Annual Savings
effective on 10/1/10
(WSRF), effective on 10/1/15
(CRIAC), effective on 5/1/17
The CEO and General Manager recommends in the FY’20 Budget increasing the discount for the Clean Rivers Impervious Area Charge from 50% to 75% This will help address the issue identified by the independent rate consultant
18
(with 75 percent CRIAC Discount for CAP)
19
By increasing the discount for the Clean Rivers Impervious Area Charge, CAP customers would decrease the percentage of household income spent on water and sewer bills
CAP Thresholds State Median Income $105,173 Area Median Income1 $121,300 Projected FY2021 Projected FY2021 Projected FY2021 CAP - Up to 60% SMI 20% $21,035 6.32% 1.93% $922.80 30% 31,552 4.21% 1.29% 922.80 40% 42,069 3.16% 0.96% 922.80 50% 52,587 2.53% 0.77% 922.80 60% 63,104 2.11% 0.64% 922.80 CAP2 - Up to 80% AMI 80% $97,040 1.37% 0.76% $594.48 CAP3 - Up to 100% AMI 100% $121,300 1.10% 0.95% $175.68 Notes: 1 - AMI based on 2019 data as published by the U.S. Department of Housing and Urban Development. Annual Bill as % of Income (before Discount) Annual Bill as % of Income (w Discount) Annual Savings
(with 50% & 75% CAP Discount)
20
0.0% 1.0% 2.0% 3.0% 4.0% 5.0% 6.0% 20% 30% 40% 50% 60% 80% 100%
CAP Bill, 50% Disc., % AMI CAP Bill, 75% Disc., % AMI
$24,260 $36,390 $48,520 $60,650 $72,780 $97,040 $121,300 CAP CAP2 CAP3
21 Units DC Water Water and Sewer Retail Rates (1) Ccf 66.25 $ 73.30 $ 78.92 $ DC Water Clean Rivers IAC ERU 20.94 19.52 18.40 DC Water Customer Metering Fee 5/8" 3.86 4.96 7.75 DC Water Water System Replacement Fee 5/8" 6.30 6.30 6.30 Subtotal DC Water Rates & Charges 97.35 $ 104.08 $ 111.37 $ Increase / Decrease 5.01 $ 6.73 $ 7.29 $ District of Columbia PILOT Fee (1) Ccf 2.76 $ 2.93 $ 3.04 $ District of Columbia Right-of-Way Fee (1) Ccf 1.03 1.03 1.03 District of Columbia Stormwater Fee (4) ERU 2.67 2.67 2.67 Subtotal District of Columbia Charges 6.46 $ 6.63 $ 6.74 $ Total Amount 103.81 $ 110.71 118.11 Increase / Decrease Over Prior Year 5.11 $ 6.90 $ 7.40 $ Percent Increase in Total Bill 5.2% 6.6% 6.7% Less: CAP Discount (4 Ccf per month) (1), (2) (50.60) (55.96) (60.08) Water System Replacement Fee (WSRF) (3) (6.30) (6.30) (6.30) Clean Rivers IAC (5) (10.47) (14.64) (13.80) Total Amount Appearing on DC Water Bill 36.44 $ 33.81 37.93 Increase / Decrease Over Prior Year 0.90 $ (2.63) $ 4.12 $ CAP Customer Discount as a Percent of Total Bill
(1) Assumes average monthly consumption of 5.42 Ccf, or (4,054 gallons) (2) Expansion of CAP program in FY 2009 assumes discount to first 4 Ccf of Water and Sewer and to first 4 Ccf of PILOT and ROW in FY 2011 (3) Assumes 100 percent discount for Water System Replacement Fee (WSRF) to CAP customers effective October 1, 2015 (4) District Department of the Environment stormwater fee of $2.67 effective November 1, 2010 (5) Assumes 50 percent discount for FY2020 and 75% discount for FY2021 and FY2022 for the Clean Rivers IAC
Proposed FY 2021 Proposed FY 2022 Current FY 2020
22
Assumes average residential consumption of 5.42 Ccf, or 4,054 gallons, per month. Ccf = hundred cubic feet, or 748 gallons. Note: Reflects rates and fees in place as of November 1, 2019.
23
This budget continues shifting a portion of Clean Rivers costs to the sewer volumetric rate
Category-wise Impact of 28% CRIAC Shift to Sewer – FY 2021
Category Pre Shift Sewer Post Shift Sewer Pre Shift CRIAC Post Shift CRIAC Sewer Incr/(Decr) CRIAC Incr/(Decr) Sewer+CRIAC Net Incr/(Decr) Residential $61,432,669 $64,398,839 $31,390,976 $27,564,186 $2,966,170 ($3,826,790) ($860,620) Commerciial 108,318,384 113,548,349 37,390,834 32,832,617 5,229,965 (4,558,217) 671,748 Multi Family 76,517,215 80,211,716 14,710,368 12,917,066 3,694,501 (1,793,302) 1,901,199 Federal 38,765,402 40,637,122 21,658,180 19,017,889 1,871,720 (2,640,291) (768,571) Municipal 6,921,227 7,255,406 9,172,047 8,053,907 334,179 (1,118,140) (783,960) Housing 7,339,532 7,693,908 1,381,353 1,212,956 354,377 (168,397) 185,979 TOTAL: $299,294,430 $313,745,341 $115,703,758 $101,598,622 $14,450,911 ($14,105,137) $345,775
24
Category-wise Impact of 37% CRIAC Shift to Sewer – FY 2022
Category Pre Shift Sewer Post Shift Sewer Pre Shift CRIAC Post Shift CRIAC Sewer Incr/(Decr) CRIAC Incr/(Decr) Sewer+CRIAC Net Incr/(Decr) Residential $66,289,607 $69,081,432 $29,639,972 $25,982,634 $2,791,825 ($3,657,338) ($865,513) Commerciial 116,882,161 121,804,721 35,305,156 30,948,779 4,922,559 (4,356,377) 566,182 Multi Family 82,566,755 86,044,101 13,889,817 12,175,923 3,477,346 (1,713,894) 1,763,453 Federal 41,830,239 43,591,944 20,450,077 17,926,699 1,761,705 (2,523,378) (761,673) Municipal 7,468,427 7,782,964 8,660,426 7,591,798 314,537 (1,068,628) (754,091) Housing 7,919,804 8,253,351 1,304,300 1,143,360 333,547 (160,940) 172,607 TOTAL: $322,956,994 $336,558,513 $109,249,748 $95,769,193 $13,601,519 ($13,480,555) $120,964
Monthly Average Household Average Multi-Family Sample Commercial Sample Cemetery Sample Non-profit (High Con) Sample Non-profit (Low Con) Monthly CCF 5.42 86.14 3,332.33 4.70 804.07 7.36 ERU 1 6.83 52.2 115.1 128.6 59.2 FY2020 Monthly Total Bill $104 $1,341 $49,575 $2,793 $14,877 $1,591 FY 2021 Estimated Total Bill with 28% IAC recovered through Volumetric Charge $111 $1,447 $53,958 $2,637 $15,788 $1,519 FY 2022 Estimated Total Bill with 37% IAC recovered through Volumetric Charge $118 $1,538 $57,966 $2,516 $16,672 $1,466 25
26
DC Water’s 10-year financial plan serves as the fiscal roadmap to achieve the Board’s strategic plan It is one of management’s key tools to monitor progress in meeting financial goals and targets It also ensures meeting or exceeding all debt-related legal and policy requirements, as well as maintaining sufficient liquidity to meet all current financial obligations DC Water’s financial plan objectives focus on:
27
Maintain Debt Service as a percentage of revenue equal to 33.0 percent or less Maintain combined coverage of 160 percent Maintain 250 days of cash including Rate Stabilization Fund FY 2019 actual consumption declined by 1.8 percent. Assumed 1.5 percent conservation each for FY 2020 and FY 2021 and 1.0 percent in FY 2022 and onwards FY 2019 Debt Service was lower as compared to budget due to deferring bond issuance as well as achieving lower interest than projected. The new plan assumed lower interest rates with slightly lower Debt Service projections
28
29
OPERATING FY 2020 FY 2021 FY 2022 FY 2023 FY 2024 FY 2025 FY 2026 FY 2027 FY 2028 FY 2029 Retail* 571,666 $ 607,107 $ 630,495 $ 669,848 $ 723,657 $ 752,224 $ 791,988 $ 833,503 $ 879,616 $ 928,122 $ Wholesale* 82,539 81,986 84,445 86,978 89,588 92,275 95,044 97,895 100,832 103,857 Other 44,774 42,145 40,858 44,081 46,959 51,637 54,692 54,970 56,935 57,752 RSF
10,500
698,979 $ 733,738 $ 766,298 $ 800,907 $ 860,204 $ 896,136 $ 941,724 $ 986,368 $ 1,037,383 $ 1,089,731 $ Operating Expenses (347,881) (365,658) (376,303) (387,553) (399,149) (411,101) (423,421) (436,120) (449,209) (462,701) Debt Service (205,137) (222,268) (240,497) (257,460) (271,238) (286,756) (299,489) (315,321) (332,807) (348,316) Cash Financed Capital Improvement (28,556) $ (30,355) $ (37,830) $ (46,889) $ (50,656) $ (60,178) $ (71,279) $ (75,015) $ (79,165) $ (83,531) $ Net Revenues After Debt Service 117,405 $ 115,456 $ 111,668 $ 109,005 $ 139,161 $ 138,101 $ 147,535 $ 159,912 $ 176,202 $ 195,183 $ Operating Reserve-Beg Balance 186,764 180,000 185,000 194,000 201,000 205,000 215,000 220,000 230,000 240,000 Other Misc (Disbursements)/Receipts Wholesale/Federal True Up (5,372) (3,184) (5,490)
(4,000) (4,000)
(13,000)
(101,797) (103,272) (97,178) (102,005) (135,161) (128,101) (142,535) (149,912) (166,202) (185,183) Operating Reserve - Ending Balance 180,000 $ 185,000 $ 194,000 $ 201,000 $ 205,000 $ 215,000 $ 220,000 $ 230,000 $ 240,000 $ 250,000 $ Rate Stabilization Fund Balance RSF (2) (74,450) $ (71,950) $ (61,450) $ (61,450) $ (61,450) $ (61,450) $ (61,450) $ (61,450) $ (61,450) $ (61,450) $ Senior Debt Service Coverage 459% 502% 533% 513% 616% 647% 632% 618% 660% 769% Combined Debt Service Coverage 171% 172% 169% 170% 179% 177% 181% 182% 184% 187% Actual/Projected Water/Sewer Rate Increases 11.5% 9.9% 7.8% 8.5% 7.5% 7.5% 7.5% 7.5% 7.5% 7.5% *Operating Receipts $ Increase/Decrease Retail 7,460 35,441 23,388 39,353 53,809 28,567 39,764 41,514 46,113 48,507 Wholesale 423 (554) 2,460 2,533 2,609 2,688 2,768 2,851 2,937 3,025 *Operating Receipts % Increase/Decrease Retail 1.3% 6.2% 3.9% 6.2% 8.0% 3.9% 5.3% 5.2% 5.5% 5.5% Wholesale 0.5%
3.0% 3.0% 3.0% 3.0% 3.0% 3.0% 3.0% 3.0%
(1) Includes interest earnings on senior lien revenue bonds' debt service reserve fund (2) FY 2021 planned transfers of $0.0 million to Rate Stabilization Fund and $2.5 million utilization will bring the total fund balance to $71.95 million$ in thousands
30
Metrics Indenture Requirement Board Policy Management Target Days of Cash on Hand _ $125.5 million or 120 Days 250 Days Combined Coverage Ratio _ _ 1.6X Senior Coverage 1.2X 1.4X _ Subordinate Coverage 1.0X 1.0X _ Debt Service as a % of Revenue _ _ 33% of Revenue or Less Rate Stabilization Fund _ _ 10% of Revenue
Projected average monthly residential customer bill ranges from $104 in FY 2020 to $180 in FY 2029
$104 $111 $118 $126 $137 $143 $151 $160 $170 $180 $0 $20 $40 $60 $80 $100 $120 $140 $160 $180 FY 2020 FY 2021 FY 2022 FY 2023 FY 2024 FY 2025 FY 2026 FY 2027 FY 2028 FY 2029 Average Residential Customer Monthly Bill ($)
Clean Rivers IAC Water & Sewer Charges District of Columbia Fees (PILOT, ROW & Stormwater) Customer Metering Fee Water System Replacement Fee
* Assumes average residential consumption of 5.42 Ccf, or 4,054 gallons, per month. Ccf = hundred cubic feet, or 748 gallons
31
Residential – Avg. 5.42 Ccf / 1 ERU Base 2020 2021 2022 2023 2024 2025 2026 2027 2028 2029 Water & Sewer Rate (%) 11.5% 9.9% 7.8% 8.5% 7.5% 7.5% 7.5% 7.5% 7.5% 7.5% CRIAC ($/ERU) $20.94 $19.52 $18.40 $19.58 $24.07 $23.07 $23.82 $24.56 $25.64 $26.78
$104 $111 $118 $126 $137 $143 $151 $160 $170 $180
5.2% 6.6% 6.7% 6.7% 8.8% 4.4% 5.7% 5.8% 6.1% 6.2% Multi-family – Avg. 86.14 Ccf / 6.83 ERU Base 2020 2021 2022 2023 2024 2025 2026 2027 2028 2029 Water & Sewer Rate (%) 11.5% 9.9% 7.8% 8.5% 7.5% 7.5% 7.5% 7.5% 7.5% 7.5% CRIAC ($/ERU) $20.94 $19.52 $18.40 $19.58 $24.07 $23.07 $23.82 $24.56 $25.64 $26.78
$1,341 $1,447 $1,538 $1,654 $1,791 $1,896 $2,022 $2,157 $2,304 $2,461
8.1% 8.0% 6.2% 7.6% 8.3% 5.9% 6.6% 6.7% 6.8% 6.8% Commercial – Avg. 115.82 Ccf / 14.17 ERU Base 2020 2021 2022 2023 2024 2025 2026 2027 2028 2029 Water & Sewer Rate (%) 11.5% 9.9% 7.8% 8.5% 7.5% 7.5% 7.5% 7.5% 7.5% 7.5% CRIAC ($/ERU) $20.94 $19.52 $18.40 $19.58 $24.07 $23.07 $23.82 $24.56 $25.64 $26.78
$2,029 $2,163 $2,285 $2,456 $2,669 $2,814 $2,994 $3,189 $3,401 $3,629
6.8% 6.6% 5.7% 7.5% 8.7% 5.4% 6.4% 6.5% 6.7% 6.7%
32
33
Board Member Questions & Follow Up
Wholesale Customer Briefing – January 10 Committee Reviews, Recommendations & Actions – January & February Board Adoption – March 5
Environmental Quality & Operations DC Retail Water & Sewer Rates Finance & Budget FY 2020 - FY 2029 Capital Budget (Disbursements & Lifetime) Action Required Action Required FY 2021 Operating Budget Action Required Intent to Reimburse Capital Expenditures with Proceeds of a Borrowing Action Required FY 2020 – FY 2029 Financial Plan Action Required Action Required FY 2021 & 2022 Rates, Charges & Fees Action Required
34
35
The proposed FY 2020 disbursement includes the underspending from FY 2019 to remain congruent with previously approved rate increases Ramp-up to modified Baseline CIP beginning in FY 2021
36
Service Area ($000's) FY20 FY21 FY22 FY23 FY24 FY25 FY26 FY27 FY28 FY29 10-Yr Total Last Year's CIP (Increase) /Decrease Non-Process Facilities 42,066 $ 31,849 $ 20,665 $ 6,831 $ 11,058 $ 10,396 $ 3,901 $ 3,553 $ 3,560 $ 3,600 $ 137,479 $ 138,067 $ 588 $ Wastewater Treatment 77,536 102,976 113,378 107,232 107,312 70,680 97,878 101,839 132,256 138,165 1,049,252 978,738 (70,514) Clean Rivers 162,197 147,565 179,833 129,272 67,536 59,909 148,771 103,265 88,890 115,049 1,202,288 1,262,589 60,301 Combined Sewer 9,239 9,493 12,816 16,553 16,731 8,568 6,699 7,572 8,972 12,435 109,078 79,178 (29,900) Stormwater 6,869 9,631 7,535 4,170 5,392 4,660 4,201 4,306 6,869 5,057 58,690 68,608 9,918 Sanitary Sewer 44,933 63,926 115,541 88,110 91,562 138,341 159,814 176,789 175,873 174,032 1,228,922 957,135 (271,787) Water 62,163 88,677 108,878 109,000 92,905 101,765 116,319 146,791 154,916 154,697 1,136,112 945,015 (191,097) CAPITAL PROJECTS 405,004 454,118 558,645 461,168 392,496 394,318 537,584 544,115 571,337 603,035 4,921,821 4,429,330 (492,491) Capital Equipment 31,703 37,207 33,790 32,315 33,000 33,000 33,000 33,000 33,000 33,000 333,015 340,324 7,309 Washington Aqueduct 15,515 16,266 18,572 37,841 12,699 33,875 9,508 12,863 24,068 13,971 195,178 187,127 (8,051) ADDITIONAL CAPITAL PROGRAMS 47,218 53,473 52,362 70,156 45,698 66,875 42,509 45,863 57,068 46,971 528,193 527,450 (743) TOTAL CIP 452,223 $ 507,590 $ 611,008 $ 531,322 $ 438,194 $ 461,193 $ 580,093 $ 589,978 $ 628,404 $ 650,006 $ 5,450,013 $ 4,956,780 $ (493,233) $ Last Years CIP 420,342 467,016 561,724 530,006 422,607 450,358 585,454 535,666 544,490 439,117 4,956,780 (Increase)/Decrease (31,880) (40,574) (49,284) (1,317) (15,587) (10,835) 5,361 (54,312) (83,914) (210,890) (493,232)