
SLIDE 1
Output Devices: Graphics, 3-D Sound, and Haptic Displays
Output Devices: Graphics, 3-D Sound, and Haptic Displays Output - - PowerPoint PPT Presentation
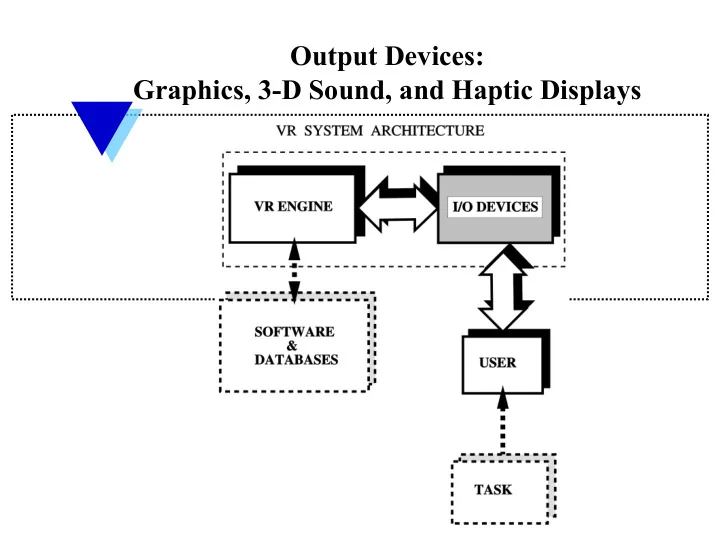
Output Devices: Graphics, 3-D Sound, and Haptic Displays Output Devices The human senses need specialized interfaces The human senses need specialized interfaces Graphics displays for visual feedback; 3-D audio hardware for localized
Output Devices: Graphics, 3-D Sound, and Haptic Displays
Output Devices
The human senses need specialized interfaces The human senses need specialized interfaces
Graphics displays for visual feedback; 3-D audio hardware for localized sound; Haptic interfaces for force and touch feedback; Not interested in smell and taste feedback.
Definition: Definition: A graphics display is a computer interface that presents synthetic world images to
virtual world.
Output Devices
Graphics Displays Graphics Displays
Human stereo viewing; Personal displays; Large volume displays:
–Active glasses – Workbenches; – Caves; – Walls;
Output Devices
Human Visual System Human Visual System
Vision is the dominant sensorial channel; FOV 1200v, 1500h (1800 for both eyes) Depth perception in mono images is based
blocks another from view;
motion parallax (closer objects appear to move more than distant ones).
Output Devices
Human Visual System Human Visual System-
continued
Depth perception in stereo is based on stereopsis
when the brain registers and fuses two images;
Image parallax means that the two eyes
register different images (horizontal shift);
The amount of shift depends on the “inter-
pupillary distance” (IPD) (varies for each person 53-73 mm);
Works in the near field (to a few meters from the
eye)
Output Devices
Implications for Stereo Viewing devices Implications for Stereo Viewing devices
Need to present two images of the same VR
environment;
The two images can be presented at the same
time on two displays (HMD);
The two images can also be presented time-
sequenced on one display (active glasses);
The two images can also be presented spatially-
sequenced on one display (auto-stereoscopic displays).
Output Devices
Personal Displays Definition: Definition: A graphics display that outputs a virtual scene destined to be viewed by a single
stereoscopic, monocular (for a single eye)
Output Devices
Personal Displays Personal Displays
Head Mounted Displays; 3-D Binoculars (hand supported); Booms (floor supported); Virtual windows (floor supported); Auto-stereoscopic displays (desk supported). Output Devices
Simplified HMD optics model Simplified HMD optics model
HMD
Image is seen floating 1-5m in front of the
user.
Optics to fill as much of the FOV.
– Virtual granularity (arc-min/pixel) increases
HMD integration in a VR system HMD integration in a VR system
Consumer HMD Professional HMD
Olympus Eye Trek Face Mounted Display (FMD 200)
AMLCD display, Resolution: 267x225 FOV: 30x23 degrees– Equivalent to 62 in at 2 m Weight: 100 grams Can be worn over glasses
Olympus Eye Trek Head Mounted Display Optics – uses free-form lens to compensate for aberrations;
Olympus Eye Trek Face Mounted Display Optics
Daeyang “cy-visor” Face Mounted Display
LCOS display, Resolution: 800x600 FOV: 60x43 degrees– Weight: 160 grams Can be worn over glasses
Liquid Crystal on Silicon display (LCOS)
It is reflective – needs external lighting
Daeyang “cy-visor” Face Mounted Display
Professional HMDs
Kaiser ProView AMLCD display, Resolution: 1024x768 FOV: 28x21 degrees– Weight: 992 grams 1.6 arcmin/pixel 19500$
Three LCD panels: R G B Fewer visual artifacts
Professional HMDs
N-Vision Datavisor CRT display, Resolution: 1280x1024 FOV: 78x39 degrees– Weight: 1587 grams
1 Monochrome CRT with 3 R-G-B filters alternating in time Can be used for see-through apps
LCOS Virtual Binoculars
Virtual Binoculars
User can go in/out of VR environment Zoom allowed
Floor-supported displays
Boom3C (courtesy of Fakespace Labs.)
Floor-supported displays
Mechanical trackers allow almost zero
latency
Larger FOV and resolution Limited motion (dead zone)
Virtual Window 3-D Display (courtesy of Virtual Research Co.)
21” LCD display, Resolution: SXGA (1600x1200) Weight: Counter- Balanced; No dead space but High latencies due to Third-party tracker Monoscopic display Handles assist navigation
Auto Auto-
stereoscopic displays
do not require use of special glasses; Passive auto-stereoscopic displays do not track
user’s head and thus restrict user’s position;
Active auto-stereoscopic displays track the head
motion and give more freedom of motion..
The two views are presented in a column interlaced
format.
Horizontal resolution is limited. Output Devices
Lenticular autostereoscopic displays
Lenticular lenses superimposed on an LCD
display that is column-interlaced.
Each lens two sub-pixels wide Left half directed towards left eye, right half
directed towards right eye.
Fixed viewing spot.
Lenticular autostereoscopic displays
Lenticular autostereoscopic displays
Can be active or passive (track the users’
head)
Multiview displays can be constructed Commercially available products.
Passive Auto-stereoscopic 3-D Display (Dimension Technologies Co.)
Auto-stereoscopic 3-D Display(courtesy of Dimension Technologies Co.)
18.1” LCD display, Resolution: 1280x1024 (mono) 640 x 1024 (stereo) Weight: 11.25 kg
Active auto-stereoscopic 3-D Display (courtesy of Dresden 3D Co.)
18” LCD display, Resolution: 1280x1024 (mono) 640 x 1024 (stereo) Weight: 17 kg
Active tracking accommodates ±25 degrees Change in view direction
Large Volume Displays Large Volume Displays
Allow several co-located users to view a
monoscopic or stereoscopic view of the virtual world;
Can be classified as monitor-based large
volume displays or projector-based large volume displays.
Allow more freedom of motion vs. personal
displays.
Output Devices
Monitor Monitor-
based Large Volume Displays
Use active or passive glasses; Several users can look at a monitor; Can have a single monitor, or multiple side-by-
side monitors;
If side-by-side, image continuity becomes an
issue.
Output Devices
Active glasses
Stereo views are time alternating Monitor should operate at twice the normal
refresh rate
Monitor & glasses are IR synchronized Can be combined with tracking to change
view according to viewing direction
– For multiple viewers, one user controls the view direction others see artefacts (tilted
Untracked and wireless Tracked and wireless Active glasses
Some advantages: no cables if head position is not tracked; light and ergonomic (can be used over vision glasses); work well with large volume displays. allows full screen resolution 1280x1024 Some disadvantages: lose 2/3 of image light intensity through LCD filtering; require special CRT “stereo ready” that has twice the hardware refresh rate (Hz) 120 Hz or more; require direct line of sight for IR controller; different viewing metaphor “through the window”. Active glasses vs. FMDs Output Devices
wireless Wired to the synchronizing jack of the graphics card Active glasses
Active glasses system
Passive glasses
Polarized Anaglyph (cannot display color images)
Increased immersion through larger FOV
– Smaller viewing distance – Larger screen size
Multipanel displays Can be generated by different graphics
pipelines: they should be synchronized
Tiled monitors-based display Resolution is 3840 x 1024 and dimensions are 1,11 x 0.29 m2
Link to VC 3.1 on book CD
Non-synchronized tiled image Synchronized tiled image discontinuity
Projector Projector-
based Large-
Volume Displays
Old technology is CRT-based
(analog) three projector tubes (R, G, B);
Requires special “fast green” coating to avoid the
fogging due to fast switching (at 120 Hz for frame sequential stereo);
Suffer from low luminosity problems
(200-300 lumens)
Output Devices
Passive glasses (polarized)
– One projector, double frequency, alternating polarization – Two projectors, normal frequency, fixed polarization in front of each projector
Active shutter glasses
– Double frequency synchronized projector.
Projector Projector-
based Large-
Volume Displays
Technology makes transition from CRT-based
(analog) to Digital Micro-mirror Device (DMD) (digital) projectors;
Workbench-type displays (Fakespace Responsive
Workbench, Barco Baron, V-desk, etc.)
Cave-type display (CAVE, RAVE) Wall-type displays Domes Output Devices
Digital Micro-mirror Device Display DLP technology from TI
Light intensities are much larger than for CRT-based projectors 300 lumens to 1000 or more lumens Thus ambient light does not hinder image quality
Output Devices
The old Fakespace “ImmersaDesk” workbench
Tilted surface Reflector mirror Floor CRT projector (not shown)
Viewing Cone
Tall structures will be clipped: stereo collapse effect
Baron workbench (courtesy of BARCO Co.)
IR Controllers CRT Projector Mirrors Tilting mechanism
Workbench-type display geometries Baron V-desk
CAVE 3-D large volume display (courtesy of Fakespace Co.) Invented at Un Illinois @ Chicago
CRT Projector Mirror Screen
CAVE 3-D large volume display (courtesy of Fakespace Co.)
Image on floor created so that the shadows are behind the user Each wall is driven by a different graphics workstation
RAVE (“Re-configurable Virtual Environment”) Modular construction ( 4 modules) that allows various viewing configuration, from flat wall, to angled theater, to CAVE; Vertical wall image 2.3 m X 2.4 m; Several CRT projectors (260 lumens, 1280x1024 resolution); 500.000$
Link to VC 3.2 on book CD
Accommodate more users Using a single projector on a large wall means small image resolution; Thus tiled displays place smaller images side-by-side so they need multiple projectors; Images need to have overlap, to assure continuity; However overlap from two projectors means intensity discontinuity (brighter images in the overlap areas) Projectors need to modulate intensities to dim their light for overlap pixels. Wall-type displays Output Devices
Pano-Wall display
Three projectors;
PanoWall display
Output Devices
Tiled composite image from four projectors
Tiled composite image from four projectors after adjustment
Multiple projectors arranged around a hemi-sphere (back projection) V-dome (SEOS): 7 projectors Image pre-distortion is necessary. IMAX-3D Polarized glasses can be used Dome-type displays
Advantages:
Disadvantages: Large cost (up to millions of dollars); Even with multiple projectors, resolution is much lower than for CRTs (because the area is large).
monitor has 18,200,000 pixels/m2 To have equal numbers of pixels/unit must use more projectors (military) Wall and Dome-type displays
Definition: Definition: Sound displays are computer interfaces that provide synthetic sound feedback to the user interacting with the virtual world. The sound can be monoaural (both ears hear the same sound) or binaural (each ear hears a different sound). 3 3-
D Audio Displays
Output Devices
3 3-
D Audio Displays
3-D audio should not be
confused with stereo sound;
Human hearing model; HRTF-based 3-D sound; Convolvotron; 3-D sound cards. Output Devices
….
Stereo vs. 3-D sound Reflected sound should be also taken into account
Human Hearing Model Human Hearing Model
Head attached polar coordinate system azimuth, elevation, distance (range); Different cues are utilized in order to
infer azimuth, elevation & range cues;
Output Devices
Head Related Transfer Function (HRTF) Output Devices
Azimuth cues Maximum for θ=90, minimum when source in front or behind the head
Azimuth cues
The closest ear hears a sound with higher
intensity (head shadow effect)
Interaural intensity difference (IID) Detectable for high freq. Sounds (>1.5Khz) For lower frequencies ITD dominates (near
sources)
Elevation cues
Reflections in pinna help in elevation
determination – Cones of confusion
Some frequencies are amplified other are
suppressed.
3-D Sound
Effect of pinna filtering of sound (elevation cues)
Range cues
Prior knowledge of a given source
combined with the perceived intensity
Motion parallax: change of azimuth when
user translates head
Large motion parallax indicates source is
near
Range cues
Ratio of direct versus reflected sound Direct sound energy drops with square of
distance
Reflected sound energy does not change
much with range
Small ratio of direct/reverberated sound: far
source.
HRTF
Source position known, should model the
sound reaching the inner ear: Head related transfer function
Depends on person, azimuth, elevation,
frequency & range (only for near field sources).
Experimental evaluation.
NASA again a pioneer in 3 NASA again a pioneer in 3-
D sound
put microphones in dummy
heads;
played localized sound and
measured signal;
Determined the HRIR FT->HRTF; Worked on first circuitry; Output Devices
For a sound to be localized: convolve the
appropriate HRTF with the sound (using FIR filters) – High computational load (increases with number of sources)
Not very good results when using HRTF
from other persons.
Compromise: use “generic” HRTF.
….
The Convolvotron PC 3-D sound boards
….
The Huron workstation
Speaker based sound
Stereo sound Multichannel 5.1 sound Sound seems to stick in the room perimeter. Sound coming from a location other than
loudspeakers cannot be realized
Use of two loudspeakers to create surround
sound (phantom speakers)
….
Cross Cross-
talk effect
Sound from one speaker reaches both ears:
Hl,l Hl,r Hr,l Hr,r Yleft Yright Sleft Sright
where Hl,l is the HRTF between the left speaker and the left ear,
Hl,r is the HRTF between the right speaker and the left ear, Yleft is the sound reaching the left ear Yright is the sound reaching the right ear
where Yleft and Yright are known (the output of the convolving process)
Cross Cross-
talk effect cancellation
Sound from both speakers is adjusted such that:
Hl,l Hl,r Hr,l Hr,r
Yleft Yright Sleft Sright
Haptic Interfaces Haptics Haptics… …
Comes from Greek αφή meaning the
sense of touch;
Groups touch feedback and force feedback Output Devices
Touch (tactile) Feedback Touch (tactile) Feedback
Relies on sensors in and close to the skin; Conveys information on contact surface
geometry, roughness, slippage, temperature;
Does not actively resist user contact motion; Easier to implement than force feedback. Output Devices
Force Feedback Force Feedback
Relies on sensors on muscle tendons and
bones/joints proprioception;
Conveys information on contact surface
compliance, object weight, inertia;
Actively resist user contact motion; More difficult to implement than touch feedback
(no commercial products until mid 90s).
Output Devices
Haptic Interfaces Human touch sensing mechanism Human touch sensing mechanism
Most touch sensors are on the hand (much less
density on other parts of the body);
Four primary types of sensors: 40 % are Meissner’s corpuscles – detect movement across the skin – velocity detectors 25% are Merkel’s disks – measure pressure and vibrations 13 % are Pacinian corpuscles – deeper in skin (dermis) – acceleration sensors Most sensitive to vibrations of about 250 Hz 19% are Rufini corpuscles – detect skin shear and temperature changes
Haptic Interfaces
Skin touch sensors
Haptic Interfaces Sensorial adaptation Sensorial adaptation
Measure the decrease in electrical signals from
the skin sensor over time, for a constant stimulus;
If the sensor produces a constant electrical
discharge for a constant mechanical stimulus – called “Slow Adapting” (SA);
Detect constant or slowly changing forces
(Merkel & Rufffini)
Haptic Interfaces Sensorial adaptation Sensorial adaptation
If the rate of electrical discharge drops rapidly
“Rapidly Adapting” (RA)
Detect vibrations, accelerations on the skin
(high frequency forces): Meissner & Pacinian
Haptic Interfaces Spatial resolution Spatial resolution
Receptive field size of a sensor; If the sensor has a large receptive field – it
has low spatial resolution (Pacinian and Ruffini) SA-II, RA-II
If the receptive field is small – has high
Spatial resolution (Meissner and Merkel) SA-I, RA-I
Temporal resolution
Haptic Interfaces
Two-point limen test: 2.5 mm fingertip, 11 mm for palm, 67 mm for thigh
Haptic Interfaces
Haptic Interfaces Temperature sensing Temperature sensing
Proprioception Proprioception
Kinesthesia Kinesthesia
Sensory-motor control
Tactile, proprioceptive & kinesthetic
sensing used by sensory-motor control to affect forces on an object or haptic interface
Precision grasp: dexterous object
manipulation, fingers
Power grasp: higher force exertion: fingers
& palm
Haptic Interfaces
Human grasping configurations
Haptic Interfaces Maximum and sustained force exertion Maximum and sustained force exertion
Maximum force exerted during “power” grasp
Averages 400 N (male) and 225 N (female);
Sustained force is much smaller than
maximum, owing to fatigue and pain
No need for a force feedback interface to
generate large forces.
Touch Feedback Interfaces Touch Feedback Interfaces… …
Can be desk-top or wearable (gloves); Touch feedback mouse; CyberTouch glove; Temperature feedback actuators; Electrotactile feedback Output Devices
Haptic Interfaces
The iFeel Mouse (0-125 Hz).
Tactile mouse
Software detects contact between cursor and
haptically enabled borders, icons, surfaces and sends commands to the mouse.
Haptic “bump”: single impulse Haptic texture: complex amplitude
modulated commands
Haptic Interfaces
CyberTouch Glove (Virtex) 6 individually Controlled Vibrotactile actuators 0-125 Hz frequency 1.2 N amplitude at 125 Hz
Output Devices Combination with Cyberglove Suitable for dexterous manipulation tasks
Link to VC 3.3 on book CD
Temperature feedback Temperature feedback
Added simulation realism by simulating
surface thermal “feel”;
No moving parts; Uses thermoelectric pumps made of solid-state
materials sandwiched between “heat source” and “heat sink.”;
Single pump can produce 65°C differentials; Output Devices
Temperature feedback actuator
Temperature feedback actuator control User comfort zone 13-46°C If system fails Heat travels back Through the pump And can burn skin
Force Feedback Interfaces Force Feedback Interfaces… …
Need mechanical grounding to resist user
motion;
Can be grounded on desk, wall, or on user body; More difficult to construct and more expensive
than tactile feedback interfaces
Output Devices
Haptic Interfaces
Logitech Force feedback joystick Uses potentiometers to sense position in spherical coordinates; Uses electrical actuators to apply resistive torques;
Provides force feedback in case
(shooting, explosions, accelerations) Vibrations, springlike forces jolts
The PHANToM used for 3D “sculpting” (courtesy of SensAble Technology Co.)
6 DOF, 3 are active (provide translation
force feedback)
Small inertia & friction: efficient simulation
Mechanical bandwidth: frequency of
force/torque refreshes as felt by the user – Limited by the inertia of the structure
Peak output force 6.4 N Max continuous force: 1.7N Stiffness: 3X10³N/m : for contact with walls
and other hard objects
PHANToM 1.5/6.0 Outputs torques 56K$
The Haptic Master
3 DOF cylindrical robot Max force output 250 N Stiffness 5x10⁴ N/m Uses force-in, position-out arrangement
The CyberGrasp force feedback glove Exoskeleton
Cables and pulleys 16 N/finger (continuous?); Weight 539 grams; remote electrical actuators in a control box. Only unidirectional forces can be applied
The CyberGrasp force feedback glove
The CyberPack (courtesy of Virtex Co.)
CyberGrasp glove Electronic interface box Wrist Tracker Tether
Link to VC 3.4 on book CD
CyberForce interface (introduced recently) Allows simulation of weight and inertia, not possible with glove-only interfaces
6 DOF mechanical arm Wrist position and Force feedback – No need for a tracker
Haptic Interfaces
CyberForce interface
Link to VC 3.5 on book CD