
SLIDE 1
2013/10/24 1
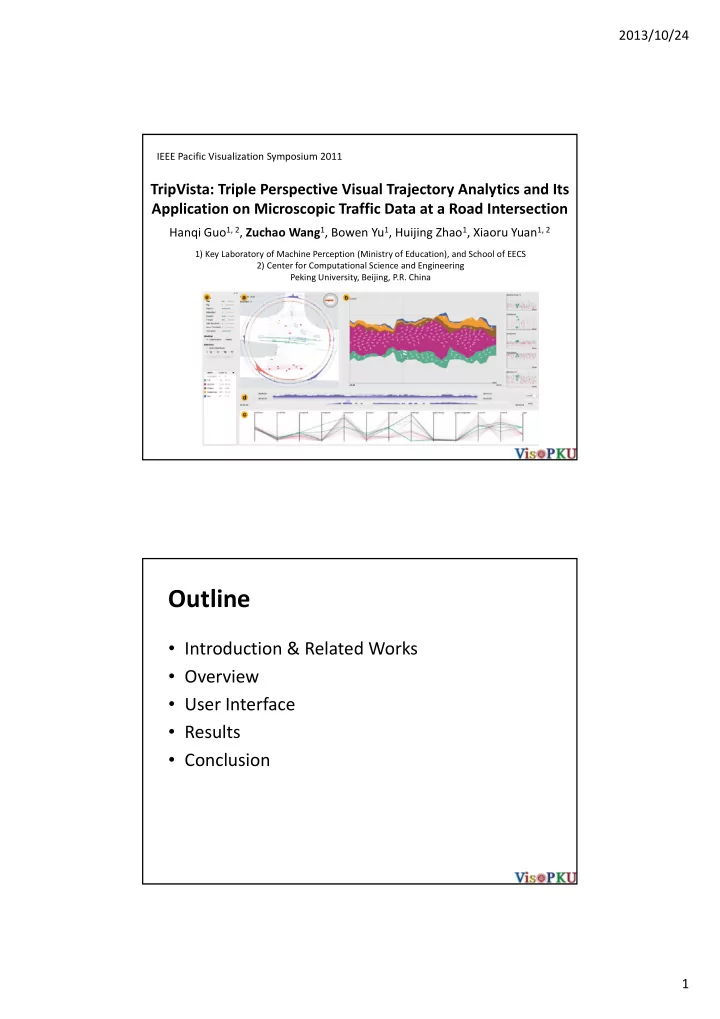
TripVista: Triple Perspective Visual Trajectory Analytics and Its Application on Microscopic Traffic Data at a Road Intersection
Hanqi Guo1, 2, Zuchao Wang1, Bowen Yu1, Huijing Zhao1, Xiaoru Yuan1, 2
IEEE Pacific Visualization Symposium 2011
1) Key Laboratory of Machine Perception (Ministry of Education), and School of EECS 2) Center for Computational Science and Engineering Peking University, Beijing, P.R. China
Outline
- Introduction & Related Works
- Overview
- User Interface
- Results
- Conclusion