
SLIDE 1
Outline Outline Characterization of Harmonics in a Utility - - PDF document
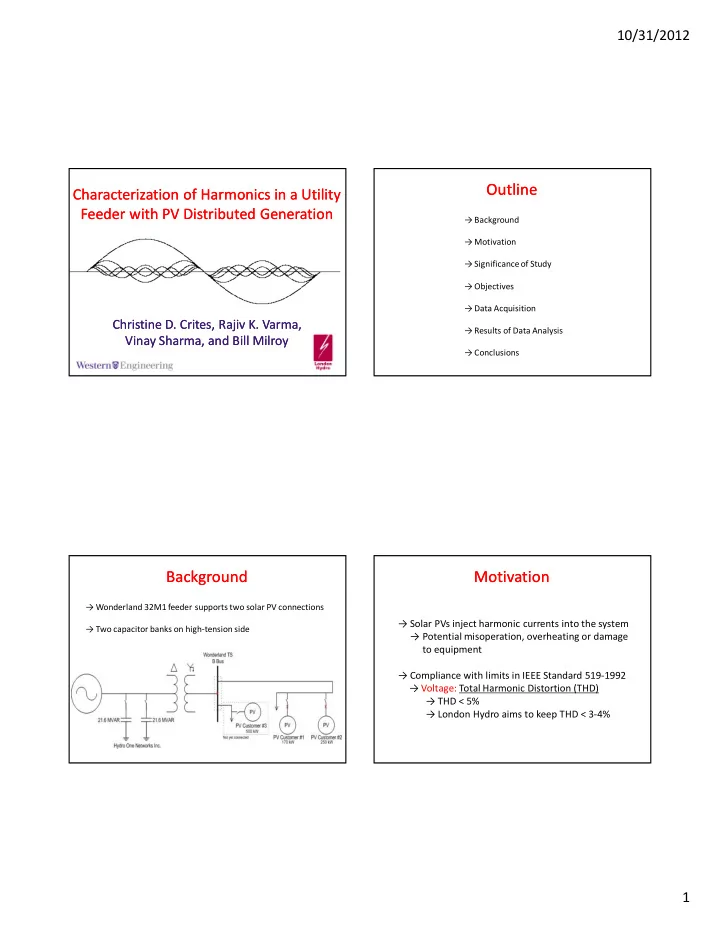
10/31/2012 Outline Outline Characterization of Harmonics in a Utility Characterization of Harmonics in a Utility Feeder with PV Distributed Generation Feeder with PV Distributed Generation Background Motivation Significance of
C A B
2 2.1 2.2 2.3 2.4 2.5 2.6 2.7 2.8 0.28 0.33 0.38 0.43 0.48 0.53 10/02/2012 0:00 10/02/2012 12:00 11/02/2012 0:00 11/02/2012 12:00 12/02/2012 0:00
Power (kW) Date & Time
Load vs. THD
Power THD
THD
0.0 10.0 20.0 30.0 40.0 50.0 60.0 0:00 4:00 8:00 12:00 16:00 20:00 0:00 4:00 8:00 12:00 16:00 20:00 % of Fundamental Time of Day
Current Distortion Over a Two-day Period
3rd 5th 7th 9th 11th 13th February 10, 2012 February 11, 2012
0.0 500.0 1,000.0 1,500.0 2,000.0 2,500.0 3,000.0 3,500.0 4,000.0 0:00 4:00 8:00 12:00 16:00 20:00 0:00 4:00 8:00 12:00 16:00 20:00 % of Fundamental Time of Day
Current Distortion Over a Two-day Period
3rd 5th 7th 9th 11th 13th February 10, 2012 February 11, 2012
1.85 1.95 2.05 2.15 2.25 2.35 2.45 2.55 2.65 2.75 2.85 2:14 4:38 7:02 9:26 11:50 14:14 16:38 19:02 21:26 23:50 THD (%) Time
THD: PVs Off & PVs On
PVs OFF (Wed Feb 8) PVs ON (Fri Feb 10)
% THD Time of Day Max 2.73 9:50 PM Min 2.06 5:50 AM Avg 2.37
% THD Time of Day Max 2.69 8:50 PM Min 1.91 4:20 AM Avg 2.27
As measured Friday February 10, 2012 @ 5:50 PM
0.5 1 1.5 2 2.5 3 3.5 4 2nd 3rd 4th 5th 6th 7th 8th 9th 10th 11th 12th 13th 14th 15th 16th 17th 18th 19th % of Fundamental Harmonic Order
Voltage & Current Harmonics
Voltage Current