outline of paper
play

Outline of paper What did they do: 1: Exposed yeast to 30/45 C for 1 - PDF document

2/26/2015 Chemometric evaluation of Saccharomyces cerevisiae metabolic profiles using LCMS Mireia Farres, Benjam Pina, Roma` Tauler Metabolomics (2015) 11:210224 Outline of paper What did they do: 1: Exposed yeast to 30/45 C for 1


  1. 2/26/2015 Chemometric evaluation of Saccharomyces cerevisiae metabolic profiles using LC–MS Mireia Farre´s, Benjam ı ´ Pin˜a, Roma` Tauler Metabolomics (2015) 11:210–224
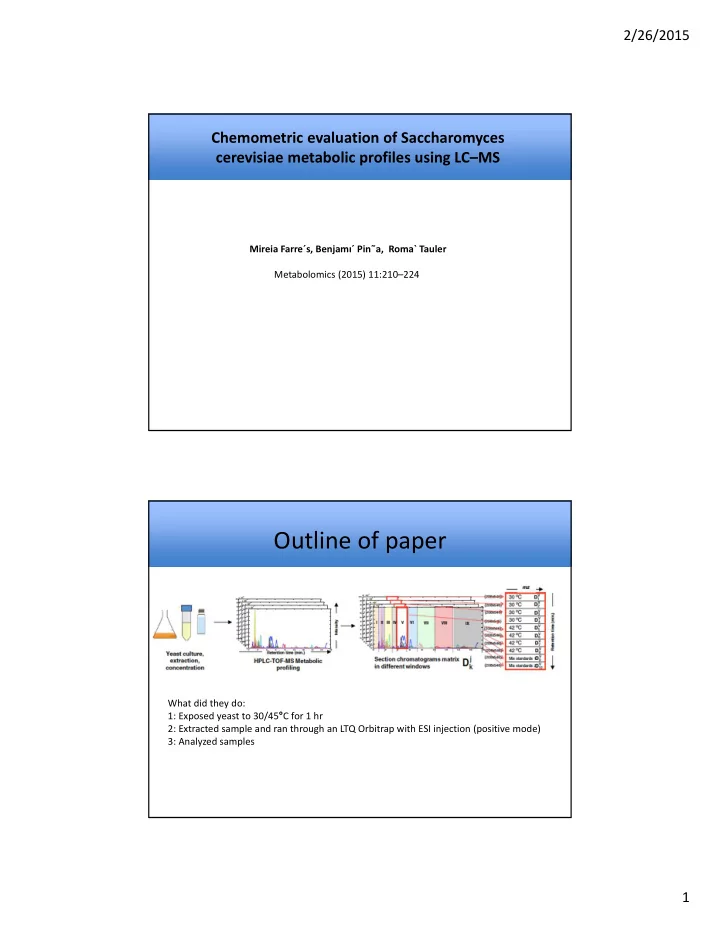
 Outline of paper What did they do: 1: Exposed yeast to 30/45 ° C for 1 hr 2: Extracted sample and ran through an LTQ Orbitrap with ESI injection (positive mode) 3: Analyzed samples 1

  2. 2/26/2015 30/45 ° C for 1 hr Cooled on ice, centrifuge, washed pellet with cold PBS N=4 Added 2 standards to Yeast strain W303a each tube + blank sample Centrifuge, washed pellet with TSK gel Amide 80 cold PBS, remove supernatant (NH 2 CO ‐ Silica) Evaporated, using N 2 Resuspended in .5mL (95% Add 75% EtOH, 3min at 80 ° C Acetonitrile), .2um filter LC and Orbitrap Solvent A: 0.5 mM ammonium acetate in 90 % acetonitrile at pH 5.5 Solvent B: 2.5 mM ammonium acetate in 60 % acetonitrile at pH 5.5 ESI 5uL LTQ Orbitrap TSK gel Amide 80 50 ‐ 1000da (NH 2 CO ‐ Silica) Resuspended in .5mL (95% Acetonitrile), .2um filter 2

  3. 2/26/2015 Data collection All data between 50 ‐ 1000 daltons Full data scan consisted of 3,587 retention times with 951 m/z data points (for each sample) Size reduced to include only m/z points between 55 and 600 Da Chromatograms interpolated to same retention time, and reduced to 2020 retention times (0 ‐ 17mins) Baseline and background correction using mean chromatogram of blank sample. Analyzed by Multivariate Curve Resolution ‐ Alternating Least Squares (MCR ‐ ALS) Total ion current (TIC): sum of m/z per unit of time Peak alignment using Correlation Optimization Warping (COW) “the segment m, which is the length of the sections in which the chromatogram is divided, the slack size t, which is the maximum chromatographic peak warping allowed and a reference chromatogram.” TIC matrix data was mean centered after COW alignment 3

  4. 2/26/2015 Multivariate curve resolution alternating least squares (MCR ‐ ALS) Rows of data matrices D(j/k) are the different elution times of the samples chromatographic analysis. Columns of data matrices D(j/k) are the mass spectra recorded at the different elution times. C(j/k) is the matrix of MCR ‐ ALS resolved elution profiles in window j and sample k , and S(j/T) is the matrix of their corresponding pure mass spectra. These resolved pure mass spectra can be then used for the identification of the different metabolites. E(j/k) contains the unexplained variance related to background and noise contributions not modelled by C(j/k) and S(j/T) . Multivariate curve resolution alternating least squares (MCR ‐ ALS) 4

  5. 2/26/2015 Workflow with MCR ‐ ALS PLS ‐ DA analysis using MS ‐ TIC (a ‐ c) and MCR ‐ ALS (d) 5

  6. 2/26/2015 Example of MCR ‐ ALS plot Variable importance in projection score from PLS ‐ DA vis MCR ‐ ALS alignment 6

  7. 2/26/2015 List of metabolites identified 7

Download Presentation
Download Policy: The content available on the website is offered to you 'AS IS' for your personal information and use only. It cannot be commercialized, licensed, or distributed on other websites without prior consent from the author. To download a presentation, simply click this link. If you encounter any difficulties during the download process, it's possible that the publisher has removed the file from their server.

Recommend


More recommend