
SLIDE 1
Evaluating Models of Natural Image Patches
Chris Williams
Neural Information Processing School of Informatics, University of Edinburgh
January 15, 2018
1 / 16
Outline
◮ Evaluating Models ◮ Comparing Whitening and ICA Models ◮ Spherically Symmetric Distribution ◮ Lp-spherical Distributions
2 / 16
Evaluating Models
◮ The natural way to compare models is in terms of the expected log likelihood L = E[log p(u|M)] ≃ 1 n
n
- i=1
log p(ui|M) ◮ KL(ptrue||pM) argument shows that log likelihood is highest for correct generative model ◮ Avoid overfitting issues by using a separate test set to evaluate the expectation ◮ Eichhorn, Sinz and Bethge (2009) compute the Average Log Loss ALL = 1 D E[− log p(u|M)] where D is the number of (colour) pixels in the patch. Units: bits/component
3 / 16
Comparing Whitening and ICA Models
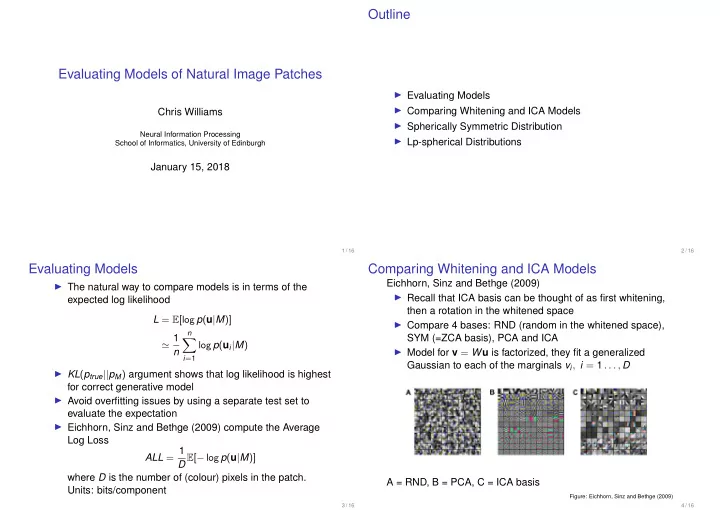
Eichhorn, Sinz and Bethge (2009) ◮ Recall that ICA basis can be thought of as first whitening, then a rotation in the whitened space ◮ Compare 4 bases: RND (random in the whitened space), SYM (=ZCA basis), PCA and ICA ◮ Model for v = Wu is factorized, they fit a generalized Gaussian to each of the marginals vi, i = 1 . . . , D A = RND, B = PCA, C = ICA basis
Figure: Eichhorn, Sinz and Bethge (2009) 4 / 16