Oklahoma Nonpoint Source Management Plan Update: 2013 Oklahoma - - PowerPoint PPT Presentation

oklahoma nonpoint source management plan update 2013
SMART_READER_LITE
LIVE PREVIEW

Oklahoma Nonpoint Source Management Plan Update: 2013 Oklahoma - - PowerPoint PPT Presentation

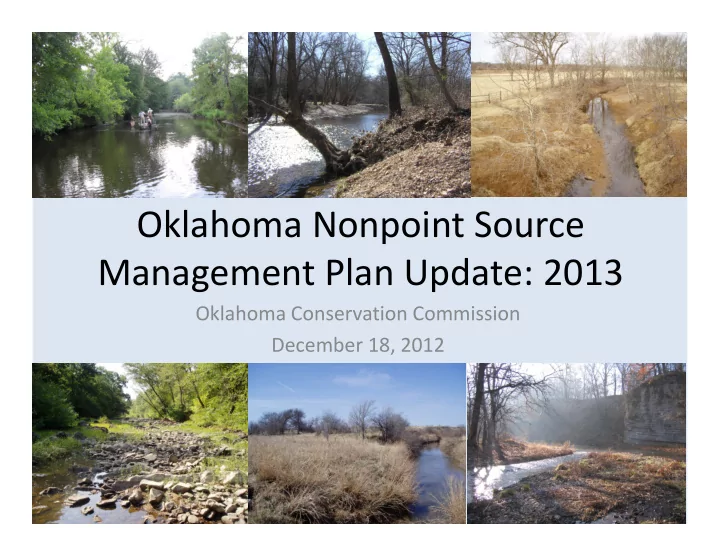
Oklahoma Nonpoint Source Management Plan Update: 2013 Oklahoma Conservation Commission December 18, 2012 Reasons to Update the Plan Changes to 319 Guidance Changes to 319 Funding Time Elapsed since the last update Timeline for Plan


slide-1
SLIDE 1

Oklahoma Conservation Commission December 18, 2012

Oklahoma Nonpoint Source Management Plan Update: 2013

slide-2
SLIDE 2

Reasons to Update the Plan

  • Changes to 319 Guidance
  • Changes to 319 Funding
  • Time Elapsed since the last

update

Timeline for Plan Update

  • Current Goal ‐ September

2013 !!!

slide-3
SLIDE 3

New 319 Guidance

  • 2012 New Guidance for 319 Program and for NPS

Management Plans

  • 319 Guidance
  • http://water.epa.gov/polwaste/nps/upload/final‐draft‐public‐

comment‐319‐guidelines2.pdf

  • Management Plan Guidance
  • http://water.epa.gov/polwaste/nps/upload/key_components_201

2.pdf

slide-4
SLIDE 4

Changes to Annual 319 Funding

$4,000,000 $3,500,000 $3,000,000 $2,500,000 $2,000,000 $1,500,000 $1,000,000 $500,000 $0

Oklahoma 319 Funding

1998 1999 2000 2001 2002 2003 2004 2005 2006 2007 2008 2009 2010 2011 2012 2013* 2014* 1993 1994 1995 1996 1997

  • Decline of $1.4 million since 2001. 28% reduction since 2011 if

additional proposed cuts are implemented (fiscal cliff?).

slide-5
SLIDE 5

Current NPS Management Plan

  • Full overhaul in 2000
  • Update in 2006 focused
  • n prioritization
slide-6
SLIDE 6

Mission and Vision Statements of the NPS Management Plan

  • Mission‐ Responsible Care for Oklahoma’s

Natural Resources

  • Vision‐ Conserve and Improve Water

Resources through Assessment, Planning, Education, and Implementation

slide-7
SLIDE 7

Long‐term Goal of the NPS Management Plan

  • By 2015, the State of Oklahoma’s NPS Program will

establish a State Approved Watershed Restoration Action Strategy, TMDL or implementation plan (unless the original basis for listing a waterbody is no longer valid) to restore and maintain beneficial uses in all watersheds identified as impacted by NPS pollution in the 1998 303(d) List. The 1998 303(d) List identifies 8,156 miles of stream and 291,293 acres of lake area as impaired or fully supporting but threatened. By 2020, the State will attain and maintain beneficial uses in waterbodies listed on the 303(d) list as threatened or impaired by NPS pollution.

slide-8
SLIDE 8

More with Less??? Or Use Every Dollar to Its Fullest

  • Review and revision about

319, including EPA and GAO studies and funding cuts, have been focused on program effectiveness.

  • Program is effective if it can

document three things:

– waterbody full or partial removal from the 303(d) list‐ NPS Success Stories(primary measure for the program) – Load reductions of nitrogen, phosphorus, and sediment – That it spends money as fast as possible

slide-9
SLIDE 9

Oklahoma Program Does Well on All 3

  • 2. Between Nov 2011 and
  • Nov. 2012, OCC NPS

program drew down

  • approx. $4,040,000 or

1.6X its annual 2012 allocation

1,000,000 2,000,000 3,000,000 4,000,000 5,000,000 6,000,000 AK AL AR AZ CA CO CT DC DE FL GA HI IA ID IL IN KS KY LA MA MD ME MI MN MO MS MT NC ND NE NH NJ NM NV NY OH OK PA RI SC SD TN TX UT VA VT WA WI WV WY Annual Load Reduction Estimate Axis Title

FY 11 CWA 319 Program Load Reductions

Nitrogen (lbs/yr) Phosphorus (lbs/yr) Sediment (tons/yr)

1. 3.

slide-10
SLIDE 10

But We Can Do Better

  • Need Additional NPS Success Stories
  • Need Additional NPS Load Reductions
  • Need More Money for the program…

How Do We Make This Happen?

  • Begins with updating the management plan
  • Continues with Revising work scope to maximize

success‐ Increasing Focus

slide-11
SLIDE 11

Revision of the NPSMP Begins with Updating the Prioritization of NPS Watersheds

  • Need to focus on smaller

watersheds‐ HUC 12 instead of HUC 11

  • Need to focus in

watersheds where success is likely (consider cause codes, etc.)

  • Need to focus in

watersheds where information about sources is well documented.

slide-12
SLIDE 12

Current NPS Watershed Prioritization Ranking Criteria

RANKING CRITERIA POINTS 15 10 5 3 % Waterbodies on 303d list in HUC ≥85% <85 to 65% <65 to 45% <45 to 25% ≥25% Pollutant severity score of HUC > 75% quartile Median to 75% quartile 25%quartile to median < 25% quartile no impairments Federal T & E species in HUC1 ≥3 2 1 Highest designated protected waterbody Scenic R./ORW HQS SWS

  • Est. decrease in wetlands, 1982

to 2002 gain or <1% 1 to 5% >5 to 10% >10% to 20% >20% USF&WS priority wetland present YES NO

  • App. B, % of HUC

upper 50th percentile lower 50th percentile no appendix B areas NRCS Local emphasis areas YES NO POINTS 7.5 5 2.5 1.5 # of PWS intakes in HUC ≥4 3 2 1 # of PWS customers served in HUC ≥100,000 999,999 ‐ 10,000 9,999 ‐ 1,000 999 ‐ 1 1‐ includes habitat for Federally threatened or endangered aquatic and semi‐aquatic organisms only.

slide-13
SLIDE 13

Pollutant Severity Score

  • NPS WG ranked

pollutants based on their relative level of concern

  • However, prioritization

doesn’t necessarily match NPS program goals to reduce N, P and sediment or to achieve WQ success

Pollutant Group Ave. Score Toxics/Bioassay 73 Pesticides 58 Low D.O. 55 Biocriteria 49 Pathogens 43 Metals 42 Phosphorus 37 Ammonia 32 Nitrate 26 Turbidity 19 Oil and grease 15 Cl/TDS/SO4 13 Taste and Odor 13 pH 12

slide-14
SLIDE 14

Which Integrated Report Should We Use as the Basis for Prioritization?

  • 2010???
  • 2012???

– Approved – Not yet submitted – Outdated sooner – Outdated later

slide-15
SLIDE 15

NRCS Local Emphasis Areas (LEA’s)

  • LEA’s allow for extra EQIP

dollars to be focused on a specific resource concern. Several success stories coincide with LEA’s.

  • Should watersheds where

NRCS, USFWS, and other programs put additional dollars toward conservation receive higher priority?

RANKING CRITERIA POINTS 15 10 5 3 NRCS Local emphasis areas YES NO

slide-16
SLIDE 16

Calculation of % WB on 303(d) List

  • Metric should likely be changed to % waterbody

impaired…

  • Calculation equates lake acres to stream miles;

however, is still heavily weighted to watersheds with reservoirs. How can we adjust the equation to give impaired reservoirs appropriate weight, but still select watersheds where measurable success is likely and timely?

– 1 square meter lake = 0.028618 meters stream length

RANKING CRITERIA POINTS 15 10 5 3 % Waterbodies on 303d list in HUC ≥85% <85 to 65% <65 to 45% <45 to 25% ≥25%

slide-17
SLIDE 17

Should Additional Criteria be Adjusted?

  • Federal T&E species in HUC

– should we include state T&E aquatic species? – Is there another parameter that should replace T&E species – Should point values change?

Photos courtesy of OWDC website

RANKING CRITERIA POINTS 15 10 5 3 Federal T & E species in HUC1 ≥3 2 1

slide-18
SLIDE 18

Should Additional Criteria be Adjusted?

  • Highest Designated Protected Waterbody

– Should this criteria remain? – Should its values be adjusted? – Should other categories be considered

RANKING CRITERIA POINTS 15 10 5 3 Highest designated protected waterbody Scenic R./ORW HQS SWS

slide-19
SLIDE 19

Should Additional Criteria be Adjusted?

  • Estimated Decrease in Wetlands (1982‐2002)
  • USFWS Priority Wetland Present

– Is there a better measure for wetlands? – What is the best source of data to track this?

RANKING CRITERIA POINTS 15 10 5 3

  • Est. decrease in wetlands, 1982

to 2002 gain or <1% 1 to 5% >5 to 10% >10% to 20% >20% USF&WS priority wetland present YES NO

slide-20
SLIDE 20

Should Additional Criteria be Adjusted?

  • % of HUC waters in Appendix B (recreational

and/or ecological significance‐ generally waters near National wildlife areas, National forests, State parks and related areas)

– Is this the best measure of ecological significance? – Should the points be adjusted?

RANKING CRITERIA POINTS 15 10 5 3

  • App. B, % of HUC

upper 50th percentile lower 50th percentile no appendix B areas

slide-21
SLIDE 21

Should Additional Criteria be Adjusted?

  • # of PWS intakes in HUC
  • # of PWS customers in HUC

– Are these the correct criteria and should we adjust the point values awarded to these? – Should water supplies with sourcewater protection plans be included in the ranking?

RANKING CRITERIA POINTS 7.5 5 2.5 1.5 # of PWS intakes in HUC ≥4 3 2 1 # of PWS customers served in HUC ≥100,000 999,999 ‐ 10,000 9,999 ‐ 1,000 999 ‐ 1

slide-22
SLIDE 22

Should Additional Criteria be Added?

  • Other criteria?
slide-23
SLIDE 23

Next Steps

  • Another webinar in late January

– Any dates to avoid? – Should we have a face to face meeting ?

  • Likely Topics of Discussion

– Further discussion of prioritization – Changes in the 319 Guidance – Review of existing Management Plan – Updating of NPS Management Plan Goals

  • Questions/Comments?

– Shanon.phillips@conservation.ok.gov – Greg.kloxin@conservation.ok.gov