
SLIDE 1
1
Oil & Gas Industry Outlook & What That Means for Real - - PowerPoint PPT Presentation
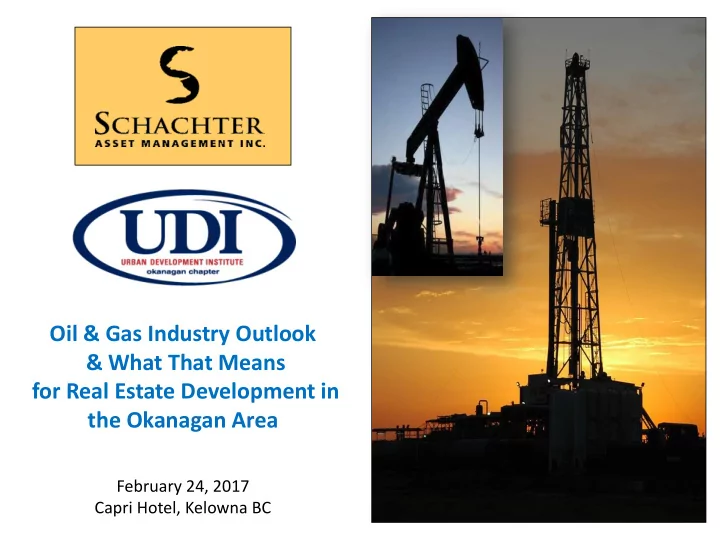
Oil & Gas Industry Outlook & What That Means for Real Estate Development in the Okanagan Area February 24, 2017 Capri Hotel, Kelowna BC 1 As a 40-year veteran of the Canadian Investment Management Industry, Josef Schachter has
1
2
3
4
Target Range Q2/16 – US$40-45/b Actual US$52/b Target Range Q3/16 – US$40-48/b Actual US$52/b Target Range Winter 2016-2017 US$48-64 US$55/b so far
Source: StockCharts.com, January 15, 2016
Transition Period Transition Period Bull Market
5
Source: StockCharts.com, January 15, 2016
Reached 125.84 Low
Bull Market Transition Period
6
7
8
Production in January 2017 by OPEC was 32.1Mb/d creating a glut/build of 1.0Mb/d
9
Source: OPEC Oil Monthly February 13, 2017
10
11 Source: Calgary Sun, 1986
12
Source: EIA US Petroleum Balance Sheet February 10, 2017
13
Source: EIA US Petroleum Balance Sheet February 10, 2017
14 Total 3Mb/d Total 5Mb/d Total 3Mb/d
15
16
17
18
Total of 1B contracts with Brent spec holdings $US77.28/b US$110.55/b US$107.68/b US$42.41/b US$26.05/b US$55.24/b
19
20
21
22
23
24
25
26
Source: Wikipedia, February 2017
27
28
29
30
31
Moving Forward
32
33
Missed Opportunity
34
35
36
37
38 Sell Zone Buy Zone
1 2 3 4 5 6 7 8 Target Q2/3 - 2017
39
Now Range bound US$49-55/b BUY Zone <US$34/b late Q2/17
20 40 60 80 100 120 140 160
EXPECTED START OF NEW BULLMARKET
Proven RLI’s 14-16 Years Proven RLI’s 7-9 Years Proven RLI’s 6-7 Years Proven RLI’s 10-12 Years
EIA data WTI February 2017
Source: SAMI, January 27, 2016 41
42
43
For a number of years private/individual clients have asked me for access to my energy research on the industry fundamentals and specific company recommendations. I now feel it is time to launch such a product.
1) Research on junior to mid-cap companies has diminished and attractive companies are getting little or no coverage (i.e. SDX very little and IPO none so far). 2) By late this year we expect that a new energy bull market will commence and may last 4-6 years! Having been cautious since Q2/14 (except for oversold rallies) we now see daylight for the sector once the upcoming shake-out in Q2/17 is over. 3) Crude oil could reach >$100/b over the next 3 years and natural gas could exceed AECO $5/mcf. 4) The TSX/Energy Index could triple in the next cycle providing even better gains for the junior and intermediate companies.
44