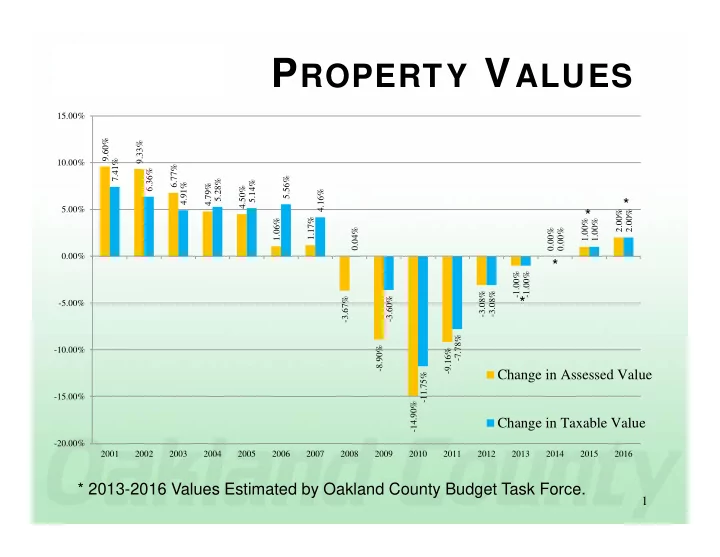
Oakland County Average Residential Change 2007 2008 2009 2010 - - PowerPoint PPT Presentation

oakland county average residential change
SMART_READER_LITE
LIVE PREVIEW

Oakland County Average Residential Change 2007 2008 2009 2010 - - PowerPoint PPT Presentation

P ROPERTY V ALUES 15.00% 9.60% 9.33% 7.41% 10.00% 6.77% 6.36% 5.56% 5.28% 5.14% 4.91% 4.79% 4.50% 4.16% * 5.00% * 2.00% 2.00% 1.17% 1.06% 1.00% 1.00% 0.04% 0.00% 0.00% 0.00% * -1.00% -1.00% -3.08% -3.08% -3.60%


slide-1
SLIDE 1

PROPERTY VALUES

1

9.60% 9.33% 6.77% 4.79% 4.50% 1.06% 1.17%

  • 3.67%
  • 8.90%
  • 14.90%
  • 9.16%
  • 3.08%
  • 1.00%

0.00% 1.00% 2.00% 7.41% 6.36% 4.91% 5.28% 5.14% 5.56% 4.16% 0.04%

  • 3.60%
  • 11.75%
  • 7.78%
  • 3.08%
  • 1.00%

0.00% 1.00% 2.00%

  • 20.00%
  • 15.00%
  • 10.00%
  • 5.00%

0.00% 5.00% 10.00% 15.00% 2001 2002 2003 2004 2005 2006 2007 2008 2009 2010 2011 2012 2013 2014 2015 2016

Change in Assessed Value Change in Taxable Value

* 2013-2016 Values Estimated by Oakland County Budget Task Force. * * * *

slide-2
SLIDE 2

1 Year Study – (used in declining markets)

9‐30‐2012 10‐1‐2011

  • Sales Study Timeframes are determined by the State Tax Commission.

How Assessments are Formulated

2

Look for Sales within this Timeframe. Look for properties like your own (subject)

2 Year Study – (used in declining markets)

9‐30‐2012 10‐1‐2010

slide-3
SLIDE 3

Oakland County Average Residential Change

Percent Change

3

  • 0.13%
  • 4.68%
  • 12.50%
  • 15.50%
  • 7.50%
  • 3.38%

1.00%

  • 18.00%
  • 16.00%
  • 14.00%
  • 12.00%
  • 10.00%
  • 8.00%
  • 6.00%
  • 4.00%
  • 2.00%

0.00% 2.00%

2007 2008 2009 2010 2011 2012 2013

slide-4
SLIDE 4

Residential Changes for 2013

4

Addison Township 1.59% Bloomfield Township 4.12% Brandon Township 2.75% Commerce Township 2.66% Groveland Township 5.14% Highland Township 2.45% Holly Township 1.78% Independence Township 3.45% Lyon Township 3.54% Milford Township 6.03% Novi Township 1.99% Oakland Township 3.24% Orion Township 3.91% Oxford Township 4.52% Rose Township

  • 0.22%

Royal Oak Township

  • 8.50%

Southfield Township 5.18% Springfield Township 2.09% Waterford Township 1.14% West Bloomfield Township 2.03% White Lake Township 2.20% Auburn Hills 0.57% Berkley 2.92% Birmingham 6.33% Bloomfield Hills 6.39% Clarkston 1.82% Clawson 2.18% Farmington 1.68% Farmington Hills 1.59% Fenton

  • 2.22%

Ferndale

  • 4.53%

Hazel Park

  • 15.07%

Huntington Woods 4.49% Keego Harbor 4.12% Lake Angelus

  • 0.30%

Lathrup Village

  • 1.52%

Madison Heights

  • 7.08%

Northville 6.81% Novi City 4.60% Oak Park

  • 10.30%

Orchard Lake

  • 0.10%

Pleasant Ridge 6.37% Pontiac

  • 17.36%

Rochester 4.54% Rochester Hills 2.86% Royal Oak City 3.52% Southfield City

  • 1.76%

South Lyon 0.69% Sylvan Lake 0.02% Troy 3.82% Walled Lake 1.70% Wixom 2.54%

slide-5
SLIDE 5

820 1,170 1,755 2,024 2,168 2,623 4,855 7,643 9,242 8486 9,290 7,371 5,108 1,000 2,000 3,000 4,000 5,000 6,000 7,000 8,000 9,000 10,000 2000 2001 2002 2003 2004 2005 2006 2007 2008 2009 2010 2011 2012

1 in 532 1 in 377 1 in 253 1 in 225 1 in 212 1 in 174 1 in 97 1 in 62 1 in 51 1 in 56

1-18-13

Oakland County - Real Properties

Sheriff Deed totals retrieved from the Oakland County Register of Deeds office.

1 in 51

Sheriff Deeds: Foreclosures

1 in 65 1 in 93

slide-6
SLIDE 6

6

Guidelines for Foreclosure Sales Bulletin No. 6 August 15, 2007

slide-7
SLIDE 7

7

slide-8
SLIDE 8

1995 2.6% 1996 2.8% 1997 2.8% 1998 2.7% 1999 1.6% 2000 1.9% 2001 3.2% 2002 3.2% 2003 1.5% 2004 2.3% 2005 2.3% 2006 3.3% 2007 3.7% 2008 2.3% 2009 4.4% 2010 -0.3% 2011 1.7% 2012 2.7% 2013 2.4%

Taxable Value Calculations are derived by using IRM/CPI percentages. This has been mandated since the introduction of proposal “A” in 1994. IRM/CPI is calculated by the US Department of

  • Labor. http://www.bls.gov/cpi

IRM – Inflation Rate Multiplier

8

IRM Also Known As: Consumer Price Index (CPI)

slide-9
SLIDE 9

IRM – 2012 Inflation Rate Multiplier

State Tax Commission Issued:

9

Also Known As: Consumer Price Index (CPI)

slide-10
SLIDE 10

10 General Property Tax Act 206 of 1893

  • Sec. 27.

(1) As used in this act, "true cash value" means the usual selling price at the place where the property to which the term is applied is at the time of assessment, being the price that could be obtained for the property at private sale, and not at auction sale except as otherwise provided in this section, or at forced sale. The usual selling price may include sales at public auction held by a nongovernmental agency or person if those sales have become a common method of acquisition in the jurisdiction for the class of property being valued. The usual selling price does not include sales at public auction if the sale is part of a liquidation of the seller's assets in a bankruptcy proceeding or if the seller is unable to use common marketing techniques to obtain the usual selling price for the property.

State Tax Commission Bulletin No. 19 of 1997

DATE: December 12, 1997 TO: Assessing Officers, Equalization Directors FROM: State Tax Commission (STC) RE: THE ILLEGAL PRACTICES OF: A) "FOLLOWING SALES" AND B) ASSESSING OVER 50%

“Proposal A does NOT authorize the assessor to AUTOMATICALLY set the assessed value

  • f a property which has sold at 1/2 of the sale price.”

(5) Except as otherwise provided in subsection (6), the purchase price paid in a transfer of property is not the presumptive true cash value of the property transferred. In determining the true cash value of transferred property, an assessing officer shall assess that property using the same valuation method used to value all other property of that same classification in the assessing jurisdiction. As used in this subsection and subsection (6), "purchase price" means the total consideration agreed to in an arms-length transaction and not at a forced sale paid by the purchaser of the property, stated in dollars, whether or not paid in dollars.

Recent Sales Price vs. Assessment Process

slide-11
SLIDE 11

11

February 25th 7pm to 9pm Board of Commissioners Auditorium

slide-12
SLIDE 12

12

What are my

  • ptions after

receiving the change

  • f Assessment Notice?
  • 1. Review Property Record Card
  • 2. Contact the Assessor
  • 3. Make Appointment for MBOR
slide-13
SLIDE 13

13

Residential Record Cards

slide-14
SLIDE 14

14

  • Land Size
  • Square Footage of Building (exterior Measurements)
  • Class of Building (A, B, C, D)
  • Garage
  • Bathrooms
  • Basement Finish
  • Built-in Appliances
  • Year Built
  • Fireplaces
  • Out-buildings, Pools, Patios, Etc.

* This is just a sample of Facts to verify and review with your assessor.

Important Items to Review on the Property Record Card

slide-15
SLIDE 15

15

MILFORD TOWNSHIP

slide-16
SLIDE 16

16

NEIGHBORHOOD S3M

slide-17
SLIDE 17

17

Target Ratio 49.0% to 50.0% / Ratio 46.93% = +6% Sales in neighborhood suggest all property values in neighborhood S3M should receive an average increase in value of +6% for 2013.

2013 Sales Study Against 2012 Values

Parcel Number Address Sale Date Sale Type Nghbd Sale Price 2012 Asd Val Ratio L -1605102012 1993 Charles Ct 5/26/2011 Valid Bank S3M $286,150 $153,750 53.73 L -1605103014 1940 Scenic Dr 9/27/2011 Valid Sale S3M $365,000 $170,550 46.73 L -1605103020 1894 Bristol Ct 6/14/2011 Valid Sale S3M $385,000 $169,940 44.14 L -1605103024 1891 Bristol Ct 12/2/2010 Valid Bank S3M $360,000 $170,170 47.27 L -1605178012 1791 Bristol Dr 6/22/2011 Valid Sale S3M $480,000 $193,720 40.36 L -1605200009 1983 Scenic Dr 9/27/2011 Valid Sale S3M $335,000 $149,110 44.51 L -1605202012 1976 Scenic Dr 9/13/2011 Valid Sale S3M $325,000 $158,020 48.62 L -1605253007 1592 Boulder Lk Dr 2/24/2011 Valid Sale S3M $290,000 $161,010 55.52 $2,826,150 $1,326,270 46.93

9‐30‐2012 10‐1‐2011

1 Year Sales Study Timeframe

slide-18
SLIDE 18

18

The average assessment change was applied to the neighborhood as a whole.

2013 Sales Study Against 2013 Values

Parcel Number Address Sale Date Sale Type Nghbd Sale Price 2013 Asd Val Ratio L -1605102012 1993 Charles Ct 5/26/2011 Valid Bank S3M $286,150 $158,750 55.48 L -1605103014 1940 Scenic Dr 9/27/2011 Valid Sale S3M $365,000 $174,330 47.76 L -1605103020 1894 Bristol Ct 6/14/2011 Valid Sale S3M $385,000 $183,850 47.75 L -1605103024 1891 Bristol Ct 12/2/2010 Valid Bank S3M $360,000 $188,220 52.28 L -1605178012 1791 Bristol Dr 6/22/2011 Valid Sale S3M $480,000 $206,850 43.09 L -1605200009 1983 Scenic Dr 9/27/2011 Valid Sale S3M $335,000 $152,190 45.43 L -1605202012 1976 Scenic Dr 9/13/2011 Valid Sale S3M $325,000 $160,740 49.46 L -1605253007 1592 Boulder Lk Dr 2/24/2011 Valid Sale S3M $290,000 $164,260 56.64 $2,826,150 $1,389,190 49.15

9‐30‐2012 10‐1‐2011

1 Year Sales Study Timeframe

slide-19
SLIDE 19

19

Assessors are responsible for valuing ALL properties in the neighborhood, not just the sold properties.

How Assessments Are NOT Formulated

Parcel Number Address Sale Date Sale Type Nghbd Sale Price 2012 Asd Val Ratio 2013 Asd Val % Chg L -1605102012 1993 Charles Ct 5/26/2011 Valid Bank S3M $286,150 $153,750 53.73 $143,070

  • 6.95%

L -1605103014 1940 Scenic Dr 9/27/2011 Valid Sale S3M $365,000 $170,550 46.73 $182,500 7.01% L -1605103020 1894 Bristol Ct 6/14/2011 Valid Sale S3M $385,000 $169,940 44.14 $192,500 13.28% L -16-05103024 1891 Bristol Ct 12/2/2010 Valid Bank S3M $360,000 $170,170 47.27 $180,000 5.78% L -1605178012 1791 Bristol Dr 6/22/2011 Valid Sale S3M $480,000 $193,720 40.36 $240,000 23.89% L -1605200009 1983 Scenic Dr 9/27/2011 Valid Sale S3M $335,000 $149,110 44.51 $167,500 12.33% L -1605202012 1976 Scenic Dr 9/13/2011 Valid Sale S3M $325,000 $158,020 48.62 $162,500 2.84% L -1605253007 1592 Boulder Lk Dr 2/24/2011 Valid Sale S3M $290,000 $161,010 55.52 $145,000

  • 9.94%

$2,826,150 $1,326,270 46.93 $1,413,070 50.00 Ratio

WRONG

9‐30‐2012 10‐1‐2011

1 Year Sales Study Timeframe

slide-20
SLIDE 20

20

MADISON HEIGHTS

slide-21
SLIDE 21

21

NEIGHBORHOOD RRM

slide-22
SLIDE 22

Parcel Number Address Sale Date Sale Type Nghbd Sale Price 2012 Asd Val Ratio 44-2502302003 1809 Millard Ave 6/15/2011 Valid Sale RRM $111,000 $51,820 46.68 44-2502304001 1635 Millard Ave 12/20/2010 Valid Sale RRM $115,000 $53,390 46.43 44-2502306020 31624 Edgeworth Dr 10/25/2010 Valid Sale RRM $105,000 $54,450 51.86 44-2502353027 31195 Edgeworth Dr 9/27/2011 Valid Bank RRM $65,000 $44,800 68.92 44-2502355014 31198 Edgeworth Dr 10/26/2010 Valid Sale RRM $72,000 $42,200 58.61 44-2502355038 1512 W 13 Mile Rd 2/25/2011 Valid Sale RRM $65,000 $41,630 64.05 $533,000 $288,290 54.09

22

Target Ratio 49.0% to 50.0% / Ratio 54.09% = -8% Sales in neighborhood suggest all property values in neighborhood RRM should receive an average decrease in value of -8% for 2013.

2013 Sales Study Against 2012 Values

9‐30‐2012 10‐1‐2011

1 Year Sales Study Timeframe

slide-23
SLIDE 23

Parcel Number Address Sale Date Sale Type Nghbd Sale Price 2013 Asd Val Ratio 44-2502302003 1809 Millard Ave 6/15/2011 Valid Sale RRM $111,000 $51,010 45.95 44-2502304001 1635 Millard Ave 12/20/2010 Valid Sale RRM $115,000 $49,290 42.86 44-2502306020 31624 Edgeworth Dr 10/25/2010 Valid Sale RRM $105,000 $51,950 49.48 44-2502353027 31195 Edgeworth Dr 9/27/2011 Valid Bank RRM $65,000 $38,550 59.31 44-2502355014 31198 Edgeworth Dr 10/26/2010 Valid Sale RRM $72,000 $35,080 48.72 44-2502355038 1512 W 13 Mile Rd 2/25/2011 Valid Sale RRM $65,000 $36,840 56.68 $533,000 $262,720 49.29

23

The average assessment change was applied to the neighborhood as a whole.

2013 Sales Study Against 2013 Values

9‐30‐2012 10‐1‐2011

1 Year Sales Study Timeframe

slide-24
SLIDE 24

Parcel Number Address Sale Date Sale Type Nghbd Sale Price 2012 Asd Val Ratio 2013 Asd Val % Chg 44-2502302003 1809 Millard Ave 6/15/2011 Valid Sale RRM $111,000 $51,820 46.68 $55,500 7.10% 44-2502304001 1635 Millard Ave 12/20/2010 Valid Sale RRM $115,000 $53,390 46.43 $57,500 7.70% 44-2502306020 31624 Edgeworth Dr 10/25/2010 Valid Sale RRM $105,000 $54,450 51.86 $52,500

  • 3.58%

44-2502353027 31195 Edgeworth Dr 9/27/2011 Valid Bank RRM $65,000 $44,800 68.92 $32,500

  • 27.46%

44-2502355014 31198 Edgeworth Dr 10/26/2010 Valid Sale RRM $72,000 $42,200 58.61 $36,000

  • 14.69%

44-2502355038 1512 W 13 Mile Rd 2/25/2011 Valid Sale RRM $65,000 $41,630 64.05 $32,500

  • 21.93%

$533,000 $288,290 54.09 $266,500 50 Ratio

24

Assessors are responsible for valuing ALL properties in the neighborhood, not just the sold properties.

How Assessments Are NOT Formulated

WRONG

9‐30‐2012 10‐1‐2011

1 Year Sales Study Timeframe

slide-25
SLIDE 25

25

Methods of Adjusting Assessments

Land Value X Land Adjustment 2013 Land Value Building Value X * ECF 2013 Building Value 2013 True Cash Value

= +

* ECF = Economic Conditions Factor by Neighborhood

slide-26
SLIDE 26

Where to f ind sales data?

  • Assessing Offices
  • Realtors
  • Access Oakland
  • Register of Deeds
  • Websites (Sales must be verified)

26

slide-27
SLIDE 27

http://www.oakgov.com/equal/info_pub/

27

2013 Assessment Data ONLINE

slide-28
SLIDE 28

28

https://gis.oakgov.com/PropertyGateway