November 7, 2018 MWDOC Joint Board Workshop Bill Hasencamp - - PDF document

november 7 2018 mwdoc joint board workshop bill hasencamp
SMART_READER_LITE
LIVE PREVIEW

November 7, 2018 MWDOC Joint Board Workshop Bill Hasencamp - - PDF document

11/6/2018 Item No. 3 November 7, 2018 MWDOC Joint Board Workshop Bill Hasencamp Metropolitan Water District 1 11/6/2018 Imperial Valley Farmer, ca. 1900 Imperial Valley, 1906 2 11/6/2018 Imperial Valley, 1906 Imperial Valley, 1906 3
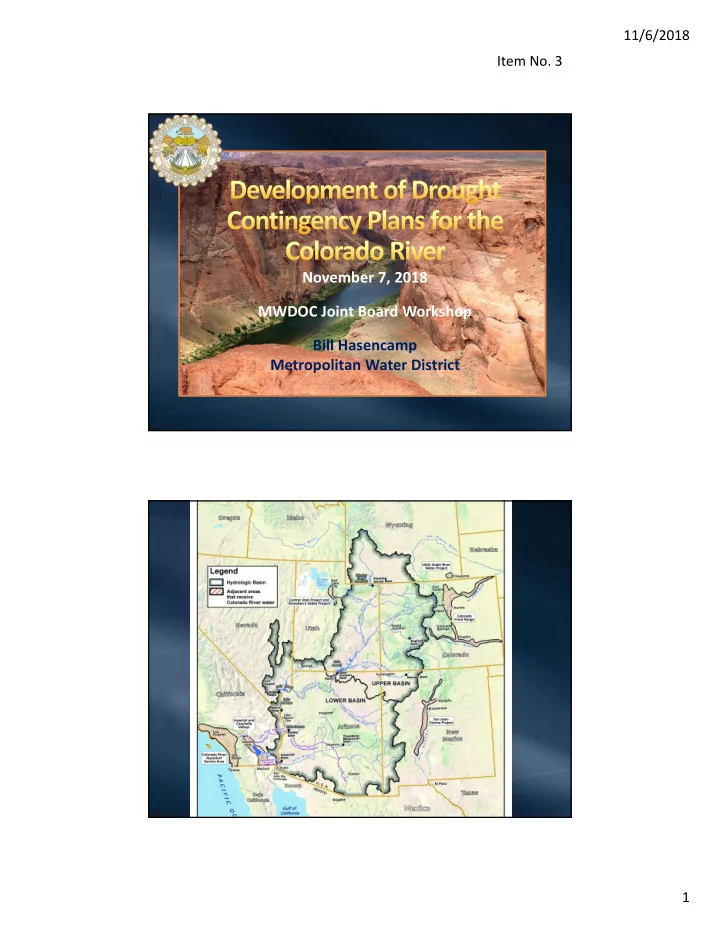

slide-1
SLIDE 1

11/6/2018 1

November 7, 2018 MWDOC Joint Board Workshop Bill Hasencamp Metropolitan Water District

Item No. 3

slide-2
SLIDE 2

11/6/2018 2

Imperial Valley Farmer, ca. 1900 Imperial Valley, 1906

slide-3
SLIDE 3

11/6/2018 3

Imperial Valley, 1906 Imperial Valley, 1906

slide-4
SLIDE 4

11/6/2018 4

Imperial Valley, 1906 The New Salton Sea, 1906

slide-5
SLIDE 5

11/6/2018 5

Black Canyon, Colorado River

Upper Basin Lower Basin Mexico 7.5 mafy 7.5 mafy + 1.0 mafy 1.5 mafy Total 17.5 mafy

slide-6
SLIDE 6

11/6/2018 6

Hoover Dam Construction, 1928 Hoover Dam Completed

slide-7
SLIDE 7

11/6/2018 7

Lake Mead Spilling, 1983

Apportionments Deliveries in 1990s

Mexico

Upper Basin States Lower Basin States

1.71 2.8 .3 1.04 3.86 4.4 .84 1.5 .05 .39 .80 2.4 .2 5.1 .49 1.8 2.5 .02

slide-8
SLIDE 8

11/6/2018 8

  • 1. Palo Verde
  • 2. Yuma Project
  • 3. (a) Imperial & Coachella

(b) Palo Verde

  • 4. Metropolitan

550 TAF Total Basic Apportionment 4.4 MAF

  • 5. Metropolitan 662 TAF
  • 6. Imperial, Coachella, Palo Verde 300 TAF

3.85 MAF

slide-9
SLIDE 9

11/6/2018 9

maf PVID Yuma Project IID 3.10 CVWD 0.33 MWD * 0.55 Total 4.40 *Amount fluctuates based on PVID/Yuma Project use, unused IID and

CVWD water

0.42 (Average)

Agricultural Conservation Measures with IID

slide-10
SLIDE 10

11/6/2018 10

Line the All‐American, Coachella Canals

0.0 0.2 0.4 0.6 0.8 1.0 1.2 2003 2004 2005 2006 2007 2008 2009 2010 2011 2012 Million Acre‐Feet Metropolitan Basic Apportionment IID‐MWD Transfer IID‐SDCWA Transfer All American & Coachella Canal Lining

slide-11
SLIDE 11

11/6/2018 11

Incentivize PVID Farmers to Not Grow Crops

slide-12
SLIDE 12

11/6/2018 12

0.0 0.2 0.4 0.6 0.8 1.0 1.2 Million Acre‐Feet (MAF) ICS Delivery SNWA Exchange IID Exchange/Unused LCWSP PVID Fallowing Program Canal Lining to MWD Canal Lining to SDCWA IID‐SDCWA Transfer IID‐MWD Conservation Adjusted Basic Apportionment

1.18 MAF Net Diversion

slide-13
SLIDE 13

11/6/2018 13

100 200 300 400 500 600 1,090 1,075 1,050 1,045 1,040 1,035 1,030 <1,025 Thousand Acre‐feet Lake Mead Elevation (feet) Nevada Shortage Arizona Shortage

Basin States Developing Drought Contingency Plans

slide-14
SLIDE 14

11/6/2018 14

8,000 9,000 10,000 11,000 12,000 13,000 14,000 15,000 16,000 17,000 18,000 19,000 20,000 21,000 22,000 23,000 x 1000 acre-feet

Lake Mead Storage 2000 – 2019, Actual and Projected Surplus Shortage

slide-15
SLIDE 15

11/6/2018 15

Probability of Mead falling below 1,020’

0% 5% 10% 15% 20% 25% 30% 35% 40% 45% 50% Occurrence Year 2007 USBR Interim Guidelines 2018 USBR Projection without Additional Actions 2018 USBR Projection with Drought Contingency Plan If Mead falls below 1,020’, AZ, NV, and CA could all face severe and sustained water curtailments

California Agreements Contractor Agreements New ICS Exhibits California ICS Agreement

  • MWD Exhibits
  • IID Exhibits
  • CVWD Exhibits
  • Metropolitan – IID
  • Metropolitan – CVWD
  • Metropolitan – PVID
  • Amendment No. 2 to the

California ICS Agreement

Lower Basin Sharing Agreement

slide-16
SLIDE 16

11/6/2018 16

200 400 600 800 1,000 1,200 Thousand Acre‐feet Lake Mead Elevation (feet) California Contribution Nevada Contribution Arizona Contribution Nevada Shortage Arizona Shortage Lake Mead 1,145’ (16.2 MAF) 895’ (0 MAF) Current Elevation 1,078.5’

Dead Pool Surplus Shortage CA DCP Contributions Begin

1,020’ (5.7 MAF) 1,045’ (7.3 MAF) 1,075’ (9.6 MAF) Elev (Available Storage) 1,090’ (10.9 MAF)

AZ and NV DCP Contributions Begin

slide-17
SLIDE 17

11/6/2018 17

6,000 7,000 8,000 9,000 10,000 11,000 12,000 13,000 14,000 15,000 16,000 17,000 18,000 19,000 20,000 21,000 22,000 23,000 x 1000 acre-feet

Lake Mead Storage 2000 – 2019, Actual and Projected

California’s DCP Trigger Shortage 0.0 0.5 1.0 1.5 2.0 2.5 3.0 3.5 Arizona California Nevada Mexico Million Acre‐Feet DCP Shortage

slide-18
SLIDE 18

11/6/2018 18

0.2 0.4 0.6 0.8 1 1.2 1.4 1.6 1.8 2 0% 20% 40% 60% 80% 100% Million Acre‐Feet Probability of Exceedance Cumulative California Contribution Average Average contribution when required is about 1 maf

How California’s DCP Contribution is shared: IID: 60%, up to the first 250,000 AF MWD: 25% and IID’s share above 250,000 AF CVWD: 7% PVID: 8%*

* PVID’s contributions to be made through existing fallowing program

slide-19
SLIDE 19

11/6/2018 19

Palo Verde Irrigation District 8% Imperial Irrigation District 60% Coachella Valley Water District 7% Metropolitan 25%

  • 1. Palo Verde
  • 2. Yuma Project
  • 3. (a) Imperial & Coachella

(b) Palo Verde

  • 4. Metropolitan

550 TAF Total Basic Apportionment 4.4 MAF

  • 5. Metropolitan 662 TAF
  • 6. Imperial, Coachella, Palo Verde 300 TAF

3.85 MAF

slide-20
SLIDE 20

11/6/2018 20

Under California DCP Implementing Agreements IID 250,000 AF CVWD 70,000 AF PVID 80,000 AF MWD ICS 350,000 AF Potential Options Interstate Banking 300,000 AF Total: 1,050,000 AF

Stabilizes Colorado River Supplies AZ, NV, & CA contribute to storage, significantly reducing risk of reaching critical storage levels Provides flexibility to meet dry year needs Provides for recovery of water at lower storage levels to meet local drought needs Protects power resources Prevents Lake Mead from reaching low levels that preclude the ability to generate power

slide-21
SLIDE 21

11/6/2018 21

Finalize agreements within California and Lower Basin Potential action item for approval by the end of the year Congressional authorization for implementation

  • f DCP