
SLIDE 1
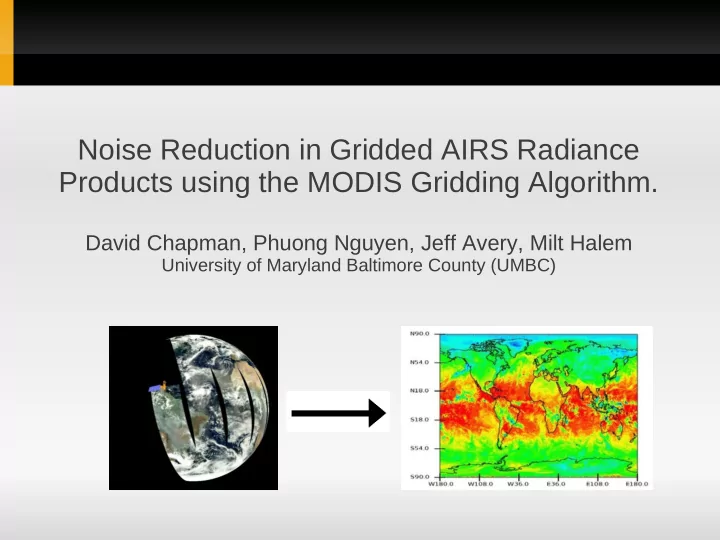
Noise Reduction in Gridded AIRS Radiance Products using the MODIS Gridding Algorithm.
David Chapman, Phuong Nguyen, Jeff Avery, Milt Halem
University of Maryland Baltimore County (UMBC)
Noise Reduction in Gridded AIRS Radiance Products using the MODIS - - PowerPoint PPT Presentation
Noise Reduction in Gridded AIRS Radiance Products using the MODIS Gridding Algorithm. David Chapman, Phuong Nguyen, Jeff Avery, Milt Halem University of Maryland Baltimore County (UMBC) Introduction Gridded data is easier to work with
University of Maryland Baltimore County (UMBC)
Gridded data is easier to work with
Corrects MANY distortions due to orbit Secondary distortions still remain
Gridding introduces errors
Footprints never align perfectly with grid cells Reduced data content 11x less data volume AIRS 360x360 Radiance Grid
Forward gridding is a simple approach where footprints
Unrealistic, observations are measured within the
Measurements are not point
How much does footprint
Integral of footprint PSF
Use Implicit PSF
~12 Billion Integrals/Day
Two methods to perform
14KM Circle
'Tophat' Dataset
Measured by Elliot,
Schreier showed
~190 MODIS footprints per AIRS footprint Calibration mean difference depends on
Linear Re-calibration to match means and standard
Image Borrowed from Knuteson et al. “Atmospheric Radiation Measurement site atmospheric state best estimates for Atmospheric Infrared Sounder temperature and water vapor retrieval validation”
The MODIS Obscov Algorithm applied numerically to AIRS
Fast numeric algorithm using AMR for “Tophat” functions Approximate PSF still slightly better
Artifact Improvements via MODIS inter-comparison
Primarily due to clouds or cloud boundaries
Significant effects
0.2 K/week 0.1K/month 0.5K/year latitudinal belt RMS
improvement]
Not as important for non-surface channels
Systematic latitudinal yearly bias
~0.15K per latitude ~1K over Mountains ~0.5K Land/ocean
Extremely regular
Does Obscov make a significant difference for
Subtraction
If so, which one is better?
Must compare to “ground truth” Inter comparison with MODIS (1KM spatial
But can we inter-calibrate precisely enough?
How does gridding affect longer timeseries
Day / Week / Month / Season / Year / Decade