NFO Opens: 11 th Feb 2015 NFO Closes: 24 th Feb 2015 Scheme Re-Opens: - - PowerPoint PPT Presentation

nfo opens 11 th feb 2015 nfo closes 24 th feb 2015 scheme
SMART_READER_LITE
LIVE PREVIEW

NFO Opens: 11 th Feb 2015 NFO Closes: 24 th Feb 2015 Scheme Re-Opens: - - PowerPoint PPT Presentation

NFO Opens: 11 th Feb 2015 NFO Closes: 24 th Feb 2015 Scheme Re-Opens: On or Before 11 th March 2015 
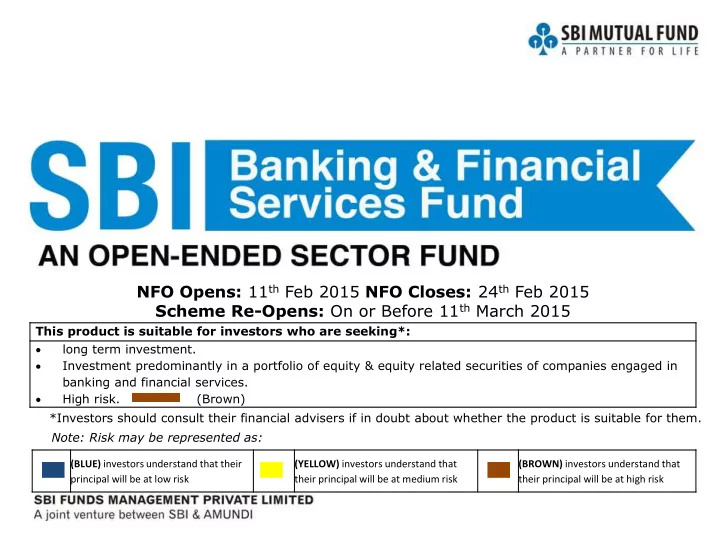
This product is suitable for investors who are seeking*: long term investment. Investment predominantly in a portfolio of equity &


slide-1
SLIDE 1

This product is suitable for investors who are seeking*:  long term investment.  Investment predominantly in a portfolio of equity & equity related securities of companies engaged in banking and financial services.  High risk. (Brown) *Investors should consult their financial advisers if in doubt about whether the product is suitable for them.

(BLUE) investors understand that their principal will be at low risk (YELLOW) investors understand that their principal will be at medium risk (BROWN) investors understand that their principal will be at high risk

Note: Risk may be represented as:

NFO Opens: 11th Feb 2015 NFO Closes: 24th Feb 2015 Scheme Re-Opens: On or Before 11th March 2015

slide-2
SLIDE 2

Index

  • Overview & Trends in Indian Banking & Financial Services
  • Growth stories in the Banking & Financial Services sector
  • Drivers of Growth
  • SBI Banking & Financial Services Fund
  • Why Invest?
  • Key Features
  • Investment Team
slide-3
SLIDE 3

Overview & Trends in Indian Banking & Financial Services

slide-4
SLIDE 4

Evolution of Indian Banking

Source: Indian Bank’s Association, ibef.org

Indian Banking: Road to Development

1806-1921

  • Bank of Calcutta

(origin of State Bank of India) established in 1806

  • Closed market
  • State-owned

Imperial Bank of India is established in 1921

1935

  • RBI established as

central bank

1936-1955

  • Imperial bank

converted to State Bank of India in 1955

1956-2000

  • Nationalisation of

banks – 14 banks in 1969 & 6 in 1980

  • Entry of private

banks in early 1990s

  • Upgradation of

technology in PSU Banks

2000

  • nwards
  • Rise in number of

banks

  • Public sector – 26
  • Private sector - 20
  • Foreign - 43
  • Introduction of

mobile & internet banking

  • Efficient Payment

Solutions adopted by Banks

  • FDI in banking
  • Abolition of branch

licensing policy for tier 2-6 centers

slide-5
SLIDE 5

Robust Growth of Banking Sector

  • Banking assets have seen growth across private sector, public sector & foreign banks
  • Deposits witnessed steady growth due to rise in household savings as a result of increase in

disposable income levels

  • Credit off-take has grown both in terms of corporate & retail loans mainly in the services, real

estate & consumer durables sectors

  • With the revival of exports, International banking expected to be the next growth region

Source: RBI

10,000 20,000 30,000 40,000 50,000 60,000 70,000 80,000 90,000 FY06 FY07 FY08 FY09 FY10 FY11 FY12 FY13 FY14

Total Deposits & Bank Credit

Deposits (Rs billion) Bank Credit(Rs billion) 52,386 60,251 71,834 83,209 95,733 1,09,635 50,000 60,000 70,000 80,000 90,000 1,00,000 1,10,000 FY09 FY10 FY11 FY12 FY13 FY14

Total banking assets (Rs. billion)

slide-6
SLIDE 6

Technological Innovations: A Paradigm Shift

  • Alternate channels like online banking, mobile banking & ATMs have led to a shift from

traditional/ brick & mortar branch banking to net banking

  • Banks are aggressively using technology at different levels to enhance customer experience
  • ATMs have increased ten-fold to 1,72,460 (Sep 2014) while the number of ATMS/ debit cards

has doubled in the last 3 years

  • Increasing use of debit cards & availability of POS machines leading the shift towards cashless

transaction settlement

*As on Sep-14 (latest published data). Source: RBI, ibef.org

17 22 27 35 44 60 75 105 142 172 20 40 60 80 100 120 140 160 180 200 2005 2006 2007 2008 2009 2010 2011 2012 2013 2014*

Number of ATMs (000' units)

264 314 373 442 50 100 150 200 250 300 350 400 450 500 Dec-11 Dec-12 Dec-13 Oct-14

Number of Debit Cards (millions)

slide-7
SLIDE 7

Emergence of Wealth Management

  • High net worth individuals (HNWI) have consistently grown in numbers
  • HNWI population is one of the primary focus of wealth management market
  • Dramatic expansion of Indian middle class in the next 30 years will create a further need for

wealth services & demand for aspirational living standard resulting into buoyancy in retail credit

  • Per capita leverage of younger generation is expected to be higher

Source: World Wealth Report, Capgemini, OECD

127 153 126 153 156 20 40 60 80 100 120 140 160 180 2009 2010 2011 2012 2013

Indian HNWI Population (k)

slide-8
SLIDE 8

Insurance Companies & NBFCs growing in prominence

  • Life insurance premium has grown by 18.4% p.a. in the last 13 years
  • Insurance penetration to GDP, in case of both life & non-life, has grown from 2.7% in 2001 to

3.9% in 2014

  • The number of lives being covered by Life Insurers has been steadily rising
  • NBFCs have rapidly grown in importance as intermediaries in retail finance space

Source: IRDA, RBI

65 59 50 43 39 24 21 20 20 28 41 57 71 108 20 40 60 80 100 120 FY01 FY02 FY03 FY04 FY05 FY06 FY07 FY08 FY09 FY10 FY11 FY12 FY13 FY14

Public Deposits of NBFC sector (Rs bn)

100,00,000 200,00,000 300,00,000 400,00,000 500,00,000 600,00,000 Sep-05 Sep-06 Sep-07 Sep-08 Sep-09 Sep-10 Sep-11 Sep-12 Sep-13 Sep-14

  • No. of lives covered under Group

Life Insurance Schemes

slide-9
SLIDE 9

Growth stories in Banking & Financial Services Sector

slide-10
SLIDE 10

Stock A: One of the Largest Private Sector Banks in India

  • One of the largest private sector banks in India; established in 1994
  • Business spread across retail banking, wholesale banking & treasury operations
  • As on 31st March 2014: Number of branches – 3,403; number of ATMS – 11,256

Source: Bloomberg, Company website

50,000 1,00,000 1,50,000 2,00,000 2,50,000 Dec-04 Dec-05 Dec-06 Dec-07 Dec-08 Dec-09 Dec-10 Dec-11 Dec-12 Dec-13 Dec-14

Market Cap of Stock A (Rs Crs)

This slide is to illustrate the theme of the fund. The performance of the stock would ultimately depend on various factors such as prevailing market condition, global political scenario, exchange rate etc. Investors are requested to note that there are various factors (both local & international) that can have an impact on the future performance & expectations of any company. This should not be construed as recommendation to buy/sell the stock in any way. Past performance may or may not be sustained in future. 200 400 600 800 1000 1200 1400 1600 1800 Jan-04 Jan-05 Jan-06 Jan-07 Jan-08 Jan-09 Jan-10 Jan-11 Jan-12 Jan-13 Jan-14 Jan-15 Rebased to 100

Price Movement

Stock A S&P BSE Bankex

slide-11
SLIDE 11

Stock B: Premier financial services company

  • Premier financial services company specializing in retail finance; established in 1986
  • Business spread across commercial vehicles financing, personal loans, small business loans &

loans against gold; strong client franchise coming from the group ecosystem

  • As on 31st March 2014: AUMs – Rs. 14,668 crs; number of branches - 980

Source: Bloomberg, Company website

This slide is to illustrate the theme of the fund. The performance of the stock would ultimately depend on various factors such as prevailing market condition, global political scenario, exchange rate etc. Investors are requested to note that there are various factors (both local & international) that can have an impact on the future performance & expectations of any company. This should not be construed as recommendation to buy/sell the stock in any way. Past performance may or may not be sustained in future. 2,000 4,000 6,000 8,000 10,000 12,000 14,000 Dec-04 Dec-05 Dec-06 Dec-07 Dec-08 Dec-09 Dec-10 Dec-11 Dec-12 Dec-13 Dec-14

Market Cap of Stock B (Rs. Crs)

1000 2000 3000 4000 5000 6000 7000 8000 9000 Jan-04 Jan-05 Jan-06 Jan-07 Jan-08 Jan-09 Jan-10 Jan-11 Jan-12 Jan-13 Jan-14 Jan-15

Price Movement

Stock B CNX Finance

slide-12
SLIDE 12

Drivers of Growth

slide-13
SLIDE 13

Policy reforms brought Financial Services in the limelight

Source: Times of India, Financial Express

slide-14
SLIDE 14

Introduction of major policy reforms

Jan Dhan Yojana

Launch of 'Pradhanmantri Jan-Dhan Yojana‘ with the aim to increase bank accounts for the poor

Insurance Bill

FDI cap increased for Insurance companies from 26% to 49%

Banking Licence

RBI started granting in-principle banking licences in 2014; IDFC & Bandhan Financial Services are the first two; niche banking licences to bring innovation

NBFC reforms

Draft guidelines allowing supermarkets and cellular phone companies etc to set up Payment Banks and permitting NBFCs to set up Small Banks

Make in India

New national program introduced by Government designed to attract investments & strengthen India’s manufacturing sector; Banks being the proxy of the Indian economy will benefit

Basel III norms

RBI announced changes for the leverage ratio under Basel III to be implemented from April 1, 2015; banks likely to need additional capital

slide-15
SLIDE 15
  • Consumer debt levels in India are significantly below other emerging & developed economies
  • Demographic composition & increasing aspirations of middle class expected to increase retail

credit

  • Limited banking penetration in India; lower than many other emerging economies like Turkey,

Brazil & South Africa

  • Banking system (including NBFCs) have less than 65% of total outstanding consumer debt
  • Share of the unorganised market (like money lenders) has been steadily falling

Low banking penetration shows latent demand

Source: Credit Suisse report dated 13th Jan 2015, RBI, World Bank

7,203 4,796 3,103 2,282 2,107 1,713 1,041 1,033 953 624

Japan Korea, Rep. Turkey Chile Ireland Netherlands South Africa Brazil India Indonesia

Deposit Accounts with Commercial Banks per 1000 adults (2011)

slide-16
SLIDE 16

Housing Finance: Under penetrated & mainly bank driven

  • Size of housing market in India was ~Rs 9 tn as on Mar-14
  • India’s mortgage penetration (8% of GDP) is low compared to other countries including emerging

economies

  • At current penetration levels, India is 9-11 years behind countries like China & Thailand
  • Currently, banks have the lion’s share of the loan assets (60% as on FY14); housing finance

companies (HFCs) have increased share from 26% to 40% in the last 10 years

Source: RBI, Credit Suisse report dated 13th Jan 2015

slide-17
SLIDE 17

Banking potential at the bottom of the pyramid

  • Banking penetration is low in India especially among the rural poor who are largely excluded

from banking services

  • Specialist Micro Finance Institutions (MFIs) & the bank-held self-help groups (SHGs) combined

cater to ~85 mn borrowers with average loan ticket size of ~Rs 8,400

  • Loan book of the micro finance industry is ~US$11.6 bn in 2014; true potential size is estimated

to be US$40-50 bn

Source: RBI, Credit Suisse, Ministry of Finance

Size of the microcredit industry (Rs mn)

slide-18
SLIDE 18

Vehicle Financing: Recovering from the bottom

  • Truck penetration in India is at least 15 years behind other emerging economies like Indonesia;

structural potential for CV sales

  • With pick-up in CV sales, CV financiers may witness strong growth in loan book
  • Organised financing in car sales in India is fairly high at ~75%; car penetration is significantly

lower indicating long term potential for auto financing

Source: Road Transport authorities of respective countries, SIAM, World Bank,Credit Suisse report dated 13th Jan 2015

slide-19
SLIDE 19

Growth pick up to revive loan growth & improve asset quality

  • Pent-up demand & Government’s focus on resolving bottlenecks likely to revive the capex cycle
  • Capacity utilisation is still not at maximum levels; excess capacity utilisation will lead to increase

in working capital availability

  • Government has taken steps to improve the funding requirement of the infra sector & to

facilitate many of stalled projects

  • Early signs of recovery seen in the corporate upgrades outnumbering downgrades for the first

time in 30 months

Source: CRISIL, CMIE, ML

slide-20
SLIDE 20

Banking & Financial Services: An all-weather theme

  • CNX Finance has outperformed other themes like FMCG, IT & Infra in the long term
  • CNX Finance has also been a relatively stable performer in the medium term unlike other themes

which have a seasonal flavour

  • CNX Finance has also outperformed broad based indices like CNX Nifty

Past performance may or may not be sustained in future. Source: Bloomberg *CNX Finance was launched in Jan 2004

Sector Average Rolling 1 year return (Period: Jan 2004* – Jan 2015)

CNX Finance 26.5% CNX FMCG 24.9% CNX IT 22.6% CNX Nifty 19.5% CNX Infra 17.0% 100 200 300 400 500 600 700 800 900 Jan-04 Jan-05 Jan-06 Jan-07 Jan-08 Jan-09 Jan-10 Jan-11 Jan-12 Jan-13 Jan-14 Jan-15 Rebased to 100

Performance of various sectors

CNX Finance CNX IT CNX FMCG CNX Infra CNX Nifty

slide-21
SLIDE 21

Pockets of value still available in the sector

  • While CNX Finance has rallied in the last year, current valuation still in sync with the broader

market valuation

  • Current P/E of CNX Finance is still 18% below its peak in the last 3 years
  • P/E dispersion of companies in the sector is between 4 to 55; areas of value still remain in the

sector

Source: Bloomberg, NSE

0.0 0.5 1.0 1.5 2.0 2.5 3.0 3.5 4.0 4.5 Jan-10 Apr-10 Jul-10 Oct-10 Jan-11 Apr-11 Jul-11 Oct-11 Jan-12 Apr-12 Jul-12 Oct-12 Jan-13 Apr-13 Jul-13 Oct-13 Jan-14 Apr-14 Jul-14 Oct-14 Jan-15

P/B of CNX Finance

5 10 15 20 25 30 Jan-10 May-10 Sep-10 Jan-11 May-11 Sep-11 Jan-12 May-12 Sep-12 Jan-13 May-13 Sep-13 Jan-14 May-14 Sep-14 Jan-15

P/E of CNX Finance

slide-22
SLIDE 22

SBI Banking & Financial Services Fund

slide-23
SLIDE 23

Banking & Financial Services: Widely Diversified Sector

Banking & Financial Services

Banking Asset Management Companies Insurance Companies Stock/ Commodities Exchange Housing Finance Micro Finance Mobile & Internet Banking Stock broking Rating Agencies

slide-24
SLIDE 24

Portfolio Construction Process

Final Portfolio Step 1: Top Down Approach

  • 1. Macro Economic Trends 2. Interest Rate Backdrop

Step 2: Sub sector Allocation

  • 1. Public Sector Banks 2. Private Sector Banks 3. Housing

Finance Cos. 4. NBFCs 5. Others

Step 3: Bottom Up Stock Selection Parameters

  • 1. Capital Adequacy 2. Asset Quality 3. Management
  • 4. Earnings 5. Liability Franchise Quality 6. Valuations

Step 4: Internal Template Constraints & Risk Metrics

slide-25
SLIDE 25

Parameters considered for allocation

Capital Adequacy

Capital Adequacy Level, Composition & Quality of Capital

Asset Quality

Reported & Forward Expectations including reported NPAs, Restructured Loans & Security Receipts

Management

Quality & Expected Changes

Earnings

Growth Expectations & Return Ratios such as Return on Assets, Return

  • n Risk Weighted Assets, Return on Equity

Liability Franchise Quality

CASA ratio, retail deposits base

Valuations

P/E. P/B, Dividend Yield

slide-26
SLIDE 26

Fund Philosophy & Asset Allocation

  • Aims to generate long-term capital appreciation from a portfolio that is invested predominantly in

equity and equity related securities of companies engaged in banking and financial services

  • Invests across market capitalization
  • Bottom-up stock allocation
  • Suitable for investors looking for exposure to the Indian financial services sector
  • Indicative Asset Allocation

*Exposure to derivatives may be to the extent of 50% of the net assets. Cumulative gross exposure through debt, equity & derivative shall not exceed 100% of the net assets of the Scheme. Exposure to securitized debt may be to the extent of 20% of the net assets. The Scheme shall not invest in ADR/GDR/Foreign securities / Foreign securitized debt. The Scheme shall not invest in repo in corporate debt. The Scheme shall not engage in short selling and securities lending

Instruments Indicative allocations (% of total assets)* Risk Profile Minimum Maximum Equity and equity related securities of companies engaged in banking & financial services 80 100 High Debt and Money Market instruments 20 Low to Medium

slide-27
SLIDE 27

Key Features

Plans/ Options The Scheme has two plans viz. Regular plan & Direct plan. Both plans would offer Growth & Dividend options. Dividend

  • ption will have the facility of Reinvestment, Payout &

Transfer Benchmark CNX Finance Index Fund Manager

  • Ms. Sohini Andani

Load Structure Entry Load: Not Applicable Exit Load: For exit within 12 months from the date of allotment -2% For exit after 12 months but within 18 months from the date

  • f allotment -1%

For exit after 18 months from the date of allotment - Nil Minimum Application Amount

  • Rs. 5,000/- and in multiples of Re. 1 thereafter

Additional Purchase Amount

  • Rs. 1,000/- and in multiples of Re. 1 thereafter
slide-28
SLIDE 28

Why Invest?

Major policy reforms undertaken in the banking & financial services sector Huge potential across banks & NBFCs due to low penetration Economic revival to revive loan growth & improve asset quality Delicate balancing between level of capital & return on equity improving efficiency in the sector

1 2 3 4

Emergence of new technologies & innovations like net banking & mobile technology to drive the sector

5

slide-29
SLIDE 29

SBI Funds Management Private Limited

63% 37%

  • India’s premier and largest bank with
  • ver 200 years experience (Estd: 1806)
  • Asset base of USD 404 bn*
  • Pan-India network of ~22,635 branches

and ~ 50,000 ATM’s as at end of June 2014

  • Servicing over 256 million customers
  • Only Indian bank in Fortune 500 list;

ranked among the top 100 banks in the world

  • Global leader in asset management
  • Backed

by Credit Agricole and Société Générale

  • More than 2,000 institutional clients and

distributors in 30 countries

  • Over 100 million retail clients via its partner

networks

  • € 843.9 bn AuM as at end of September 2014
  • Ranking N° 1 in Europe, Top 10 worldwide #

*Source: SBI Analyst Presentation as on end September 2014 # Source : Amundi website as on end September 2014

slide-30
SLIDE 30

SBI Funds Management: India’s First Bank Sponsored Funds

Source: SBI Funds Management Private Limited, AMFI; Average AUM (AAUM) for the quarter ending on December 31, 2014

Established in 1987: A leading asset manager in India

  • Expertise in managing assets across mutual funds,

segregated managed accounts, domestic advisory and

  • ffshore advisory business
  • Multiple asset classes ranging from equities and debt,

money market to ETFs and structured funds

  • Investment team of 33 professionals with strong track

record

  • Broad customer base with ~ 4.02 million folios related to

individual, corporate and institutional investors

Broad Investor Base AUM USD 14.09 bn Wide Distribution Network Experienced Investment Team Extensive Product Range Broad Investor Base AAUM

  • Rs. 72141 crs

Wide Distribution Network Experienced Investment Team Extensive Product Range

slide-31
SLIDE 31

Annexure

slide-32
SLIDE 32
  • Mr. Navneet Munot
  • Mr. Navneet Munot joined SBI Funds Management Pvt. Ltd. as Chief Investment Officer in Dec.
  • 2008. Prior to SBIFM he was the Head of Multi Strategies fund at Morgan Stanley Investment

Management before which he worked as the Chief Investment Officer (Fixed Income and Hybrid Funds) of Birla Sun Life Asset Management Company Ltd. Navneet has been associated with the financial services business of the Birla group for over 13 years and worked in various areas such as fixed income, equities and foreign exchange. His articles on matters related to financial markets have widely been published. Navneet holds a Masters in Commerce and is also a rank holder Chartered Accountant. He is a charter holder of Chartered Financial Analyst Institute, US and Chartered Alternative Analyst Institute, US. He has also done Financial Risk Management, FRM from Global Association of Risk Professionals (GARP).

  • Ms. Sohini Andani
  • Ms. Sohini Andani has experience of more than 16 years in the area of financial services. Prior to

joining SBI Funds Management Pvt. Ltd. Ms. Sohini was with ING Investment Management Pvt. Ltd., where she worked as Senior Analyst and was responsible for contributing to Fund Managers and the CIO on their equity investments. Before that she worked with many organizations viz: ASK Raymond James & Associates Pvt. Ltd., LKP Shares & Securities Ltd., Advani Share Brokers Pvt.

  • Ltd. CRISIL, K R Choksey Shares & Securities Pvt. Ltd. handling primarily equity research
  • responsibilities. Sohini is a commerce graduate from Mumbai University and a Chartered

Accountant from ICAI.

Investment Team

slide-33
SLIDE 33

SBIFM: A Complete Framework

Expertise

Highly experienced team Strong industry relations Complete in-house research

Processes

Structured & Disciplined Rigorous investment templates Agility with Flexibility

Risk Management

Six member independent team International standards Coherent monitoring

Group Advantage

25 years of experience Both domestic and international strengths Investors trust

slide-34
SLIDE 34

Disclaimer

Mutual Fund investments are subject to market risks, read all scheme related documents carefully. This presentation is for information purposes only and is not an offer to sell or a solicitation to buy any mutual fund units/securities. The views expressed herein are based on the basis of internal data, publicly available information &

  • ther sources believed to be reliable. Any calculations made are approximations meant as guidelines only, which need to

be confirmed before relying on them. These views alone are not sufficient and should not be used for the development

  • r implementation of an investment strategy. It should not be construed as investment advice to any party. All opinions

and estimates included here constitute our view as of this date and are subject to change without notice. Neither SBI Funds Management Private Limited, SBI Mutual Fund nor any person connected with it, accepts any liability arising from the use of this information. The recipient of this material should rely on their investigations and take their own professional advice