
SLIDE 1
1
TSX.V: FCC | OTCQX: FTSSF
TSX-V: FCC OTCQX: FTSSF
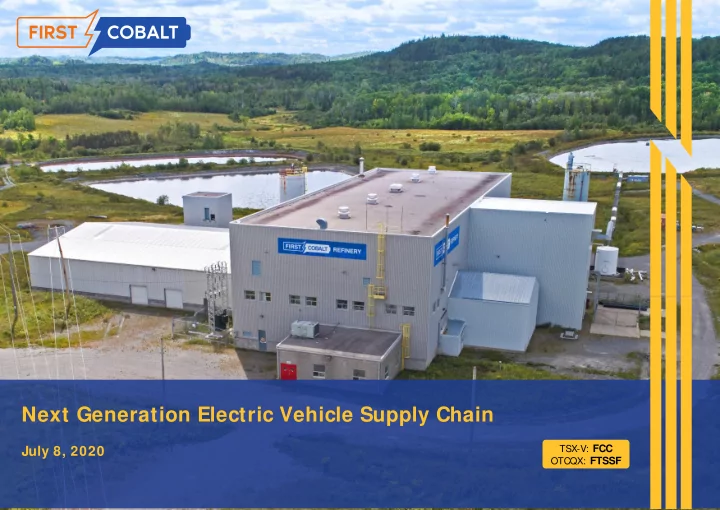
Next Generation Electric Vehicle Supply Chain TSX-V: FCC July 8, - - PowerPoint PPT Presentation
Next Generation Electric Vehicle Supply Chain TSX-V: FCC July 8, 2020 OTCQX: FTSSF TSX.V: FCC | OTCQX: FTSSF 1 All statements in this presentation other than statements of historical fact constitute forward-looking statements within
1
TSX.V: FCC | OTCQX: FTSSF
TSX-V: FCC OTCQX: FTSSF
2
TSX.V: FCC | OTCQX: FTSSF
Refinery, the processing of cobalt hydroxide feedstock, the ability to secure financing, results of exploration activities, potential acquisitions, capital expenditures, successful development of assets, currency fluctuations, government policy and regulation and environmental regulation. In particular, forward-looking information included in this presentation includes, without limitation, the opportunity to restart the First Cobalt refinery and targeted metrics. Generally, forward- looking statements and forward-looking information can be identified by the use of forward-looking terminology such as “plans”, “expects” or “does not expect”, “is expected”, “budget”, “scheduled”, “estimates”, “forecasts”, “intends”, “anticipates”, “believes”, or variations of such words or state that certain actions, events
necessarily based upon a number of estimates and assumptions that, while considered reasonable by the Company as of the date of such statements, are inherently subject to significant business, economic and competitive uncertainties and contingencies. Known and unknown factors could cause actual results to differ materially from those projected in the forward-looking statements and forward-looking information. Such factors include changes in supply and demand for cobalt, the results of metallurgical and engineering studies, changes in competitive pressures, timing and amount of capital expenditures, changes in capital markets, changes in exchange rates, unexpected geological or environmental conditions, changes in and the effects of, government legislation, taxation and regulations and political or economic developments, success in attracting officers for the future success of the Company’s business, success in obtaining any required additional financing to advance strategic priorities, and risks associated with obtaining necessary licenses or permits. Many of these uncertainties and contingencies can affect the Company’s actual results and could cause actual results to differ materially from those expressed or implied in any forward-looking statements and forward-looking information made by, or on behalf of, the Company. There can be no assurance that forward- looking statements and forward-looking information will prove to be accurate, as actual results and future events could differ materially from those anticipated in such statements. All of the forward-looking statements and forward-looking information made in this presentation are qualified by these cautionary statements. Although management of the Company has attempted to identify important factors that could cause actual results to differ materially from those contained in forward-looking statements or forward-looking information, there may be other factors that cause results not to be as anticipated. There can be no assurance that such statements will prove to be accurate, as actual results could differ materially from those anticipated in such statements. Accordingly, readers should not place undue reliance on forward-looking statements and forward-looking information. The Company does not undertake to update any forward-looking statements or forward-looking information that are incorporated by reference herein, except in accordance with applicable securities laws. Timelines used in this presentation are for the purpose of aiding management in the planning and implementation of the projects and are not based on a detailed assessment of project requirements. Consequently, the timelines are subject to material revision as subsequent technical reports and assessments are completed. Future phases of the project are contingent upon completion of preceding phases. Nothing in this presentation should be construed as either an offer to sell or a solicitation of an offer to buy or sell shares in any jurisdiction.
This presentation includes a summary of the results of a feasibility study related to the First Cobalt Refinery Project. This study does not constitute a feasibility study within the definition employed by the Canadian I nstitute of Mining, Metallurgy and Petroleum (CI M), as it relates to a stand-alone industrial project and does not concern a mineral project of First Cobalt. As a result, disclosure standards prescribed by National I nstrument 43-101 – Standards of Disclosure for Mineral Projects (NI 43-101) are not applicable to the scientific and technical disclosure in the study and in this presentation to the extent it relates to the Refinery Project.
Project (“NI 43-101”) and has reviewed and approved the technical content in this presentation. Both are employed as officers of First Cobalt. All statements in this presentation other than statements of historical fact constitute “forward-looking statements” within the meaning of the United States Private Securities Litigation Reform Act of 1995, and “forward-looking information” under similar Canadian legislation and are based on the reasonable expectations, estimates and projections of First Cobalt Corp. as
possible events, trends and opportunities and statements, including with respect to the state of the cobalt market, global market conditions, the proposed development of the First Cobalt
3
TSX.V: FCC | OTCQX: FTSSF
4
TSX.V: FCC | OTCQX: FTSSF
$0.38 ave. price 9.1M at $0.27 (exp. 03/21) 15.3M at $0.21 (exp. 02/22)
5
TSX.V: FCC | OTCQX: FTSSF
6
TSX.V: FCC | OTCQX: FTSSF
Tesla Gigafactory Tesla Plant Apple Headquarters Google Headquarters GMC Plant Ford Plant Chrysler Plant GMC Plant Toyota Plant Ford Plant LG Chem Chrysler Plant GMC Plant Honda Plant
7
TSX.V: FCC | OTCQX: FTSSF
8
TSX.V: FCC | OTCQX: FTSSF
8
(Hatch Report, 2012)
9
TSX.V: FCC | OTCQX: FTSSF
Milestones Future Catalysts
April 2019 May 2019 May 2019 Aug 2019 Oct 2019 May 2020 Q2-Q3 2020 Q3-Q4 2020 Q1 2021 Q4 2021
Glencore MOU: Feed Supply & Offtake Glencore Loan & Commencement of DFS Feasibility Study Completion Produced Battery Grade Cobalt Sulfate Refinery Scoping Study Refinery Field Work and Metallurgical Testing Commercial Terms & Financing Package Pilot Plant Testing 55 tpd Commissioning Product Qualification with End Users
10
TSX.V: FCC | OTCQX: FTSSF
11
TSX.V: FCC | OTCQX: FTSSF
1 Project economics calculated for the initial 11 years only. In
aggregate, phases 1 and 2 of the dry stack tailings areas are expected to accommodate 34 years of production
2 Does not include the purchase of cobalt hydroxide feed; however
project economics reflect a 70% long term payability assumption
Cobalt Price $25/lb Cobalt Hydroxide Payability 70% Cobalt Sulfate, Minimum Grade 20.5 % Foreign Exchange (CAD:US) 1.375 Tailings Capacity, Phase 1 17 years1
Initial Capital Requirements $56 million Total Sustaining Capital $0.6 million
Cobalt Production $1.87/lb Co2 Sodium Treatment $0.85/lb Co Total Unit Operating Costs $2.72/lb Co
Cobalt Hydroxide Feed 18.369 tonnes Feed Grade 30% Co Annual Cobalt Production 5,096 tonnes Annual Cobalt Sulfate Production 24,857 tonnes
NPV – Pre-Tax (8% Discount Rate) $192 million (C$263 million) NPV – After-Tax (8% Discount Rate) $139 million (C$191 million) IRR – Pre-Tax 64% IRR – After-Tax 53% Cash Flow – Pre-Tax $350 million (C$482 million) Cash Flow – After-Tax $259 million (C$356 million) Post-Tax NPV (8%)/Initial Capital 2.5 Payback Period 1.8 years
12
TSX.V: FCC | OTCQX: FTSSF
Dry Stack Tailings (Phase 1) Solvent Extraction Building (new) Existing Refinery Building Existing Warehouse Existing Power and Access Roads Crystallizer
(new)
Sodium Treatment
(new)
Admin Offices Analytical Lab Existing TMF Tailings Filters (new)
13
TSX.V: FCC | OTCQX: FTSSF
14
TSX.V: FCC | OTCQX: FTSSF
Limestone
15
TSX.V: FCC | OTCQX: FTSSF
I tem Annual Cost
($000 USD)
USD/ lbs
(Contained Co)
% of Total FI XED COSTS
Labour 2,634 0.23 8.6 % Maintenance 772 0.07 2.5% General & Administration 1,420 0.13 4.6%
Sub-Total (Fixed Costs) 4,827 0.43 15.7% VARI ABLE COSTS
Power 1,409 0.12 4.6% Reagents & Operating Consumables 14,808 1.31 48.2% Lab and Assay Costs 117 0.01 0.4% Sodium Treatment and Disposal 9,577 0.85 31.2%
Sub-Total (Variable Costs) 25,911 2.29 84.3% TOTAL 30,737 2.72 100%
Labour 9% Maintenance 2% G&A 5% Power 5% Reagents & Operating Consumables 48% Lab and Assay Costs 0% Sodium Treatment 31%
16
TSX.V: FCC | OTCQX: FTSSF
17
TSX.V: FCC | OTCQX: FTSSF
18
TSX.V: FCC | OTCQX: FTSSF
19
TSX.V: FCC | OTCQX: FTSSF
19
TSX.V: FCC | OTCQX: FTSSF
20
TSX.V: FCC | OTCQX: FTSSF
21
TSX.V: FCC | OTCQX: FTSSF
21
TSX.V: FCC | OTCQX: FTSSF
22
TSX.V: FCC | OTCQX: FTSSF
23
TSX.V: FCC | OTCQX: FTSSF
23
TSX.V: FCC | OTCQX: FTSSF Schematic Long Section of Resource
Resource calculation at 0.18% CoEq cutoff. Mineral Resources were estimated using the Canadian Institute of Mining, Metallurgy and Petroleum (CIM), CIM Standards on Mineral Resources and Reserves, Mineral Resources, which are not Mineral Reserves, do not have demonstrated economic viability. Complete description of estimation parameters is available within the NI 43-101 technical report available on the First Cobalt website. Long section looking Northeast through mineralization
24
TSX.V: FCC | OTCQX: FTSSF
1 2 3 4 5 6 7 8 9 10 11 12
Kerr Area
Borden Lake Drummond Silverfields Santa Maria Conisil Silver Banner Ophir Caswell Bellellen Frontier Keeley
25
TSX.V: FCC | OTCQX: FTSSF
26
TSX.V: FCC | OTCQX: FTSSF
27
TSX.V: FCC | OTCQX: FTSSF
250,000 500,000 750,000 1,000,000 2039 2034 2015 2019 Tonnes Co 2020 2018 2016 2025 2017 2021202220232024 20262027202820292030203120322033 2035203620372038 2040
Global Cobalt Demand – by end use (tonnes)
Super Alloys Hard metals Magnets Hard Facing Catalysts Ceramics/Colours Tyres, soaps, paint driers Others Battery
Benchmark Minerals Rho Motion
28
TSX.V: FCC | OTCQX: FTSSF
50,000 100,000 150,000 2018 2015 2017 Tonnes Co 2016 2025 20192020 2036 2033 2021202220232024 2040 2026202720282029 2031 2030 2038 2032 20342035 2037 2039 China Umicore Belgium Norilsk Finland Umicore Finland Sumitomo Japan
Cobalt Refinieries With Sulphate Capacity 2015 – 2040 (tonnes Co)
250,000 500,000 750,000 1,000,000 2038 2035 2015 Tonnes Co 2018 2017 2033 2016 2021 2028 2019 2020 2022 2023 2024 2025 2030 2026 2027 2029 2031 2032 2034 2036 2037 2039 2040 LCO LMO NCA NCM LMNO
Battery Driven Cobalt Demand to 2040 – by cathode chemistry
Benchmark Minerals Benchmark Minerals
29
TSX.V: FCC | OTCQX: FTSSF
10,000 20,000 30,000 40,000 50,000 60,000 70,000 80,000 90,000 2032 2015 2021 2016 2022 2039 2034 201720182019 2035 2020 202320242025202620272028202920302031 2033 203620372038 2040 Cobalt Sulphate Cobalt (battery metal)1
Cobalt Battery Metal & Cobalt Sulphate Price Forecast (US$/t)
50 55 60 65 70 75 80 85 90 95 100 Jul-18 Mar-18 Mar-19 May-18 Nov-18 Nov-19 May-19 Jan-19 Jan-18 Sep-18 Jul-19 Sep-19 Jan-20
Cobalt Hydroxide Payable Cobalt (%) Average Payable Co: 69%
Benchmark Minerals Benchmark Minerals
(Cobalt Sulfate curve for 20.5% CoSO4)
30
TSX.V: FCC | OTCQX: FTSSF
TSX.V: FCC | OTCQX: FTSSF