NEW EXPERIMENTAL INVESTIGATIONS OF ADHESIVE BONDS WITH ULTRASONIC SH - - PDF document

new experimental investigations of adhesive bonds with
SMART_READER_LITE
LIVE PREVIEW

NEW EXPERIMENTAL INVESTIGATIONS OF ADHESIVE BONDS WITH ULTRASONIC SH - - PDF document

18 TH INTERNATIONAL CONFERENCE ON COMPOSITE MATERIALS NEW EXPERIMENTAL INVESTIGATIONS OF ADHESIVE BONDS WITH ULTRASONIC SH GUIDED WAVES Patrick Prs 1* , David Barnoncel 1 , Krishnan Balasubramaniam 2 , Michel Castaings 3 1 ASTRIUM , St Mdard


slide-1
SLIDE 1

18TH INTERNATIONAL CONFERENCE ON COMPOSITE MATERIALS 1

1 Introduction ASTRIUM Space Transportation use lightweight structures made of composite materials for space

  • vehicles. Weight saving and performance increasing

have been gained by using adhesive joints. Even if a lot of attention is paid during assembling, the process of joining cannot by itself guarantee the health of the joint when complex systems are

  • manufactured. Therefore the assembling is generally

controlled with non-destructive techniques. The complexity of the shape of the joint, the anisotropy

  • f adherents made of composite materials and the

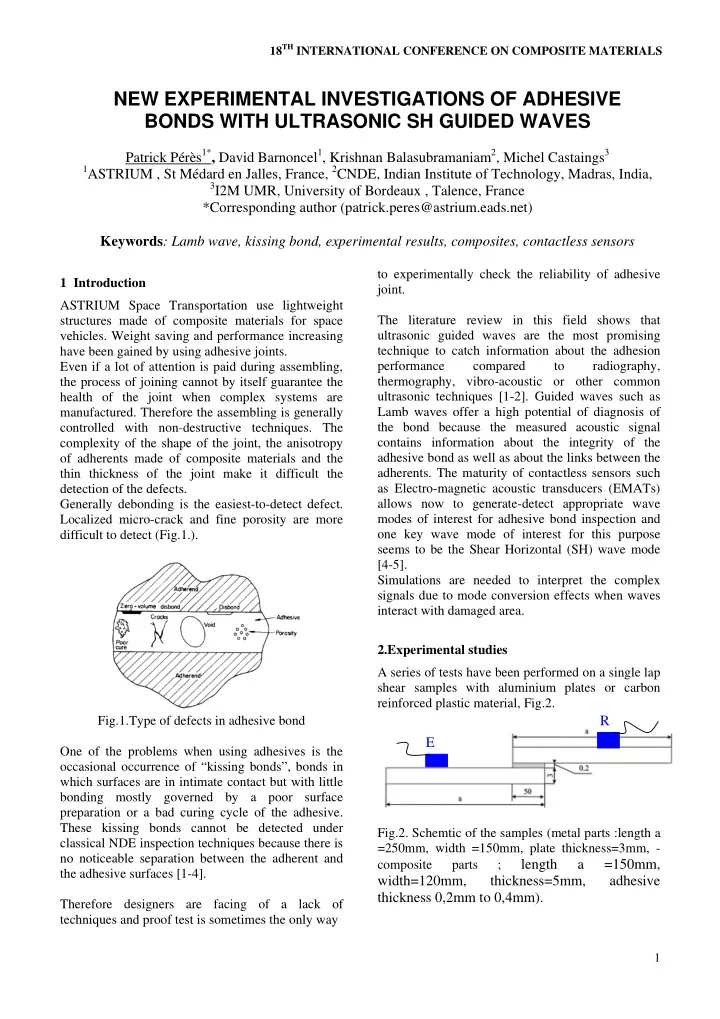
thin thickness of the joint make it difficult the detection of the defects. Generally debonding is the easiest-to-detect defect. Localized micro-crack and fine porosity are more difficult to detect (Fig.1.). Fig.1.Type of defects in adhesive bond One of the problems when using adhesives is the

  • ccasional occurrence of “kissing bonds”, bonds in

which surfaces are in intimate contact but with little bonding mostly governed by a poor surface preparation or a bad curing cycle of the adhesive. These kissing bonds cannot be detected under classical NDE inspection techniques because there is no noticeable separation between the adherent and the adhesive surfaces [1-4]. Therefore designers are facing of a lack of techniques and proof test is sometimes the only way to experimentally check the reliability of adhesive joint. The literature review in this field shows that ultrasonic guided waves are the most promising technique to catch information about the adhesion performance compared to radiography, thermography, vibro-acoustic or other common ultrasonic techniques [1-2]. Guided waves such as Lamb waves offer a high potential of diagnosis of the bond because the measured acoustic signal contains information about the integrity of the adhesive bond as well as about the links between the

  • adherents. The maturity of contactless sensors such

as Electro-magnetic acoustic transducers (EMATs) allows now to generate-detect appropriate wave modes of interest for adhesive bond inspection and

  • ne key wave mode of interest for this purpose

seems to be the Shear Horizontal (SH) wave mode [4-5]. Simulations are needed to interpret the complex signals due to mode conversion effects when waves interact with damaged area. 2.Experimental studies A series of tests have been performed on a single lap shear samples with aluminium plates or carbon reinforced plastic material, Fig.2. Fig.2. Schemtic of the samples (metal parts :length a =250mm, width =150mm, plate thickness=3mm, - composite parts ;

length a =150mm, width=120mm, thickness=5mm, adhesive thickness 0,2mm to 0,4mm).

NEW EXPERIMENTAL INVESTIGATIONS OF ADHESIVE BONDS WITH ULTRASONIC SH GUIDED WAVES

Patrick Pérès1*, David Barnoncel1, Krishnan Balasubramaniam2, Michel Castaings3

1ASTRIUM , St Médard en Jalles, France, 2CNDE, Indian Institute of Technology, Madras, India, 3I2M UMR, University of Bordeaux , Talence, France

*Corresponding author (patrick.peres@astrium.eads.net) Keywords: Lamb wave, kissing bond, experimental results, composites, contactless sensors E R

slide-2
SLIDE 2

NEW EXPERIMENTAL INVESTIGATIONS OF ADHESIVE BONDS WITH ULTRASONIC SH GUIDED WAVES 2

SH mode has been investigated in a pitch (E) and catch (R) configuration. It is generated from one plate of the lap-joint structure, and detected at the

  • ther plate. The transmission coefficient through the

lap-joint is measured by dividing the amplitude of the transmitted SH0 mode by that of the incident one. Several parameters have been investigated such as:

  • the lack of adhesive,
  • the stiffness of the joint (fully or partially cured)
  • the nature of the adherents (metal or composite),
  • the cleanness of the joint (with or without local

pollution).

  • the surface preparation
  • the adhesive thickness

3 EMAT sensors The Electromagnetic Acoustic Transducer consists

  • f a coil placed above a specimen under test and a

static magnetic field produced by a permanent

  • magnet. When an alternating current is pulsed

through the coil, eddy currents will be induced inside the specimen and these induced currents will experience Lorentz forces when they interact with an external static magnetic field. These sensors cannot be used directly with composite materials. An intermediate metallic foil glued on the sample with high viscous coupling agent is required to generate-detect the Lorentz

  • force. Significant loss in signal amplitude could

unable relevant diagnosis of the “quality” of the adhesive bond. We have used for the study two types of configuration one with one EMAT sensor as receiver , the SH wave being generated by a PZT emitter glued on the edge, the second configuration with two EMAT sensors positioned on each plate (Fig.3).

  • Fig. 3.View of the experiment with one EMAT

sensor The frequency domain range is 0.2 to 0.4 MHz. 4 Experimental results 4.1 Configuration for metallic plates with one EMAT sensor The results are here given within the frequency

  • range. The analysis of the curves shows that

measured signals are clearly separated at frequencies lower than about 0.3MHz. These results are repeatable and it can be considered that for both cases, these experimental results show that SH0 modes may be used to detect the lack of bond and pollution but the evolution of these ratios cannot allow to distinguish these two types of defects each

  • thers.

Fig.3. Measurements of SH0 mode transmission coefficient for 60% partial bond (-×-) and a full bond (--) versus frequency [7]

Fig.4. Measurements of SH0 mode transmission coefficient for a polluted bond (-×-) and a full bond (--) versus frequency [7]

Frequency (Mhz)

Full bond Partial bond

Coefficient of transmission of SH0 mode Frequency (Mhz)

Full bond Partial bond

Coefficient of transmission of SH0 mode Coefficient of transmission of SH0 mode

Full bond

Frequency (Mhz)

Polluted bond

Coefficient of transmission of SH0 mode

Full bond

Frequency (Mhz)

Polluted bond

slide-3
SLIDE 3

3 NEW EXPERIMENTAL INVESTIGATIONS OF ADHESIVE BONDS WITH ULTRASONIC SH GUIDED WAVES

4.2 Configuration for composite plates with EMAT sensors as emitter and receiver Here the signal has been analyzed with the the evolution of the signal amplitude versus flight time

  • f the wave propagation.

All the curves presented in Fig 5 are adjusted with time in order to superpose the reference curve given by the nominal adhesive bond. This adjustment has allowed verifying the reproducibility of the signals in shape and in amplitude. The strict comparison of the signals in Fig.5 is valid only if the amplitude is normalized with the emitted signal. a) Influence of the curing rate of the adhesive; in blue line 100% cured ; in red partially cured b) Influence of the thickness of the adhesive; in blue line one layer, in red 2 layers c) Influence of the roughness of the surface; in blue line the rough surface, in red the smooth one, Fig 5.: Attenuation of the signals in the reverberation area (brown circle) for different conditions of adhesive joints. The signal amplitude versus time is characterized by two groups of waves, the first one is the initial signal and the second one deals with the reverberation generated by the bonding zone. Other waves come from echoes generated by the edges of the plates. The reverberation zone shows systematically an attenuation of the amplitude in comparison of the reference signal and this is in agreement that for both conditions the visco-elasticity property of the adhesive joint has changed. Moreover one can notice that the higher attenuation is obtained when adhesive is not totally cured (Fig.5.a) as expected and this attenuation is also seen in the emitted signal. As it was pointed out with the first set of experience, we cannot discriminate the effect of roughness and adhesive thickness variation because

  • f

the similitude of the signal. 5 Numerical simulations The numerical simulation is absolutely necessary to understand the wave propagation with the numerous reflections generated in the testsample. The propagation must take into account the anisotropy of the material and its visco-elasticity property. Another difficulty is to simulate defects in terms of type and geometry and the crucial one is to describe the behavior of the interface. A schematic representation of a spring model for the interface is proposed in Fig 6 which has been used by Michel Castaings and his co-workers [3,6,7]. Fig 6: Mechanical description of the interface between the adherents and the adhesive; Kl and Kt are respectively the normal and transverse surface rigidities which are obtained by test with a specific protocol [7]. This model attempts to represent the quality of the

  • adhesion. Therefore with this model we can describe

the two limit conditions:

  • perfect joint with a cohesive rupture in the

adhesive; Kl and Kt are then infinite

Adhesive Aluminum + … + Aluminum + … + 1 2 kL kL kL kL kT kT kT kT 3 Adhesive Aluminum + … + Aluminum + … + 1 2 kL kL kL kL kT kT kT kT Adhesive Aluminum + … + Aluminum + … + 1 2 Adhesive Aluminum + … + Aluminum + … + Aluminum + … + Aluminum + … + 1 2 kL kL kL kL kT kT kT kT 3

slide-4
SLIDE 4

NEW EXPERIMENTAL INVESTIGATIONS OF ADHESIVE BONDS WITH ULTRASONIC SH GUIDED WAVES 4

  • debonding; Kl and Kt are therefore null.

We assume that pollution of the interface will mainly affect Kt. Kt parameter is determined directly by generating SH mode in the adherent in contact with another

  • material. Then Kl parameter is obtained indirectly by

doing the same experience with A0 mode which is dependant on both Kl and Kt parameters. 5.1 Simulation/experimental results comparison with metallic samples In the condition of “full bond”, the comparison between simulation and experimental results is only fair at low frequency as shown in Fig.7. One can notice that experimental discrepancy is observed at the high frequencies of the experimental domain. Fig.7. Numerical and experimental results of SH0 mode transmission coefficient for full bond versus frequency [7] Based on this result we simulated the presence of different type of defect. The partial bond is simulated by disconnecting of some nodes of the finite element mesh at the interface adherent/adhesive. The pollution is simulated by modifying Kt parameter. As it is presented in Fig.8 and Fig.9, the correlation is not good even in the lower frequency range. Different simulations have been carried out to check the sensitivity of the model to the variability of adhesive thickness, the shape of the joint,… Fig.8. Numerical and experimental results of SH0 mode transmission coefficient for partial bond versus frequency [7] Fig.9. Numerical and experimental results of SH0 mode transmission coefficient for polluted bond versus frequency [7] Fig.10. Numerical and experimental results of S0 mode transmission coefficient for partial bond versus frequency [7]

Coefficient of transmission of SH0 mode Frequency (Mhz) Experimental data Simulation Coefficient of transmission of SH0 mode Frequency (Mhz) Experimental data Simulation Coefficient of transmission of SH0 mode Frequency (Mhz) Simulation Experimental data Coefficient of transmission of SH0 mode Frequency (Mhz) Simulation Experimental data Coefficient of transmission of SH0 mode Frequency (Mhz) Experimental data Simulation Coefficient of transmission of SH0 mode Frequency (Mhz) Experimental data Simulation Coefficient of transmission of S0 mode Frequency (Mhz) Experimental data Simulation Coefficient of transmission of S0 mode Frequency (Mhz) Experimental data Simulation

slide-5
SLIDE 5

5 NEW EXPERIMENTAL INVESTIGATIONS OF ADHESIVE BONDS WITH ULTRASONIC SH GUIDED WAVES

None of these variations can correctly fit the experimental results. But it has been shown that SH0 is very sensitive to these variations with this model. In order to complete our analysis, a similar study has been performed with S0 mode. Better correlations have been obtained as illustrated in Fig.10 with the case of lack of adhesive. The conclusion of this numerical approach is that the SH model is not correct at the time being. More generally, these examples

  • f

correlation simulation/experimental results illustrated quite well that modeling of the defects in the joint regarding the guided SH wave propagation is not yet achieved and more work has to be done on these academic testsamples before expecting to be using at the industrial level. 5.2 Simulation/experimental results comparison with composite samples The frequency domain COMSOL 2.5D model was employed further to simulate the A-scans. The input displacements to the elasto-dynamic model for wave propagation were forces that were obtained using a separate COMSOL electro-magnetic model for the EMATs as described in detail elsewhere [8,9]. The frequency spectrum obtained using this hybrid model was converted to time domain in order to

  • btain the A-scans. Here, the contaminant at the

interface was modeled as layer with weak (less stiff) material properties. Here the properties of Silicone were used to simulate the contaminant since the sample was contaminated with silicone. In figure 11, a comparison between the experiment and the numerical results for a good bonded composite sample is shown with the reverberation signal clearly marked. In Fig.12, the numerical results comparing the good bond and the A-scan obtained from a sample which has contaminated interface (50% contamination with silicone) is shown. It can be clearly seen from this figure that the reverberation signal is absent in the signal obtained from the contaminated sample. Fig.11. Numerical (blue) and experimental (red) results of SH0 mode transmission coefficient for A- scans in the composite-epoxy-composite lap joint using EMAT transmitted and EMAT receiver. Fig.12. Numerical (blue) and experimental (red) results of SH0 mode transmission coefficient for A- scans in the composite-epoxy-composite lap joint using EMAT transmitted and EMAT receiver.

slide-6
SLIDE 6

NEW EXPERIMENTAL INVESTIGATIONS OF ADHESIVE BONDS WITH ULTRASONIC SH GUIDED WAVES 6

6 Conclusions SH guided waves is sensitive to the state of the adhesive bond but the main difficulty is to extract the information hidden in the signal, which can also be affected by environmental effects (material variability, geometry of the bond,..) and the accuracy

  • f the sensors. This study has also highlighted the

difficulty to discriminate the type of defect. Therefore application of this technique will require a lot of tests with different combinations of defects in comparison with references. This technique could be limited to simple joint geometry especially with composite material where the heterogeneity and anisotropy increase significantly the difficulty. EMAT sensors are appropriated for SH mode generation and detection in composites materials but the main industrial problem with composite material application is to add an intermediate metallic foil coupled with high viscous material, inducing energy loss of the signal for both emission and reception. Simulation is useful to better understand the signals because of the complexity of the wave propagation. It is absolutely necessary to take into account visco- elasticity properties of the adhesive and the adherents as well. Nevertheless simulations of the defect with the spring model are not relevant at the time being to fit the experimental results obtained with SH mode. Hence, a Frequency domain 2.5D FEM model which allowed for the introduction of a thin weak interface layer between the substrate (composite or metal) and the adhesive (epoxy) was used in simulating the Frequency domain (and subsequently using FFT to

  • btain time domain signal). The frequency domain

model allowed for the introduction of the visco- elastic nature of the composites and the epoxy

  • adhesive. The models were used to demonstrate that

the reverberation signals are generated in a non- contaminated (good) bonded sample and were found to be absent in contaminated samples. Thus the model verified that the technique of using the reverberations from an EMAT generated SH guided wave holds potential for solving the problem of inspection of adhesive bond interface contamination in aerospace bonded components. References [1] M. Castaings, B. Hosten, D François, “The sensitivity of surface guided modes to bond quality between a concrete block and a composite plate”. Ultrasonics, Vol. 42, p 1067, 2004. [2] M. J. S. Lowe, R. E. Challis, and C. W. Chan, “The transmission of Lamb waves across adhesively bonded lap joints.” J. Acoust. Soc. Am. 107, 1333– 1345, 2000. [3] B. Hosten, M Castaings, “Finite elements methods for modeling the guided waves propagation in structures with weak interfaces”. J. Acoust. Soc. Am, Vol. 117 (3), p 1113, 2005. [4] C. J. Brotherhood ,B. W. Drinkwater and, S. Dixon, “The detectability of kissing bonds in adhesive joints using ultrasonic techniques”. Ultrasonics, Vol: 41, pp.521-529, 2003. [5] S. Dixon, C. Edwards and S.B. Palmer, “The analysis of adhesive bonds using electromagnetic acoustic transducers”. Ultrasonics, Vol. 32, No 6, p 425, 1994. [6] B. Le Crom, M. Castaings, “Shear horizontal guided wave modes to infer the shear stiffness of adhesive bond layers”. J. Acoust. Soc. Am. 127 (4), pp.2220–2230, 2010 [7] H. Lourme, “Etudes des assemblages collés par

  • ndes guides ultrasonores”, Ph Thesis, Bordeaux 1

University, November 2009, n° d’ordre 3902 [8] Dhayalan R. and Krishnan Balasubramaniam, “A hybrid Finite Element Model for Simulation of Electro-Magnetic Acoustic Transducer (EMAT) based Plate Waves”, NDT and E International, 43(6) 519-526 (2010) [9] Dhayalan, R., and Krishnan Balasubramaniam, “A Two Stage Finite Element Model for a Meander Coil Electromagnetic Acoustic Transducer Transmitter”, Nondest. Test. & Eval 26(2)101-18 (2011)