
SLIDE 1
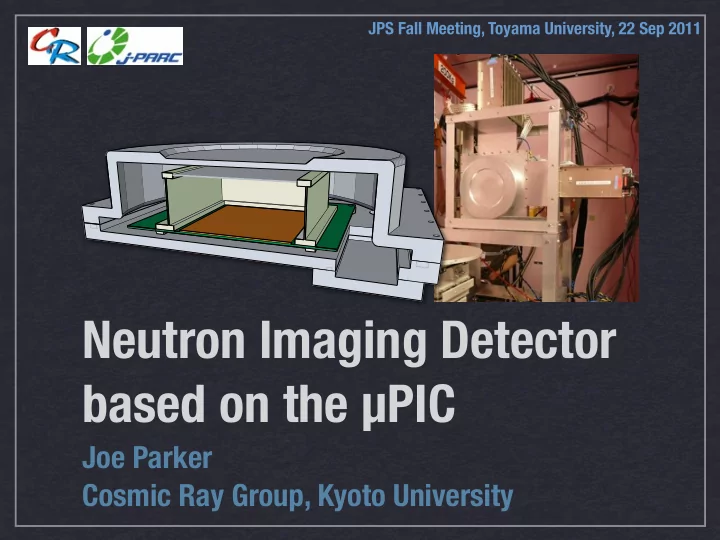
Neutron Imaging Detector based on the µPIC
Joe Parker Cosmic Ray Group, Kyoto University
JPS Fall Meeting, Toyama University, 22 Sep 2011
Neutron Imaging Detector based on the PIC Joe Parker Cosmic Ray - - PowerPoint PPT Presentation
JPS Fall Meeting, Toyama University, 22 Sep 2011 Neutron Imaging Detector based on the PIC Joe Parker Cosmic Ray Group, Kyoto University JPS Fall Meeting, Toyama University, 22 Sep 2011 KYOTO UNIVERSITY, COSMIC RAY GROUP J.D. Parker, K.
JPS Fall Meeting, Toyama University, 22 Sep 2011
KYOTO UNIVERSITY, COSMIC RAY GROUP
J.D. Parker, K. Hattori, S. Iwaki, S. Kabuki, Y. Kishimoto, H. Kubo,
JAPAN ATOMIC ENERGY AGENCY, MATERIALS AND LIFE SCIENCE FACILITY DIVISION
JPS Fall Meeting, Toyama University, 22 Sep 2011
10 cm 400 µm
10-cm µPIC
High-rate FPGA-based DAQ. TPC measures 3D proton-triton tracks. Energy deposition estimated by time- above-threshold method. Gas gain < 1000 for neutron imaging. Efficiency up to ~30%, position res. of ~120 µm, time res. of ~1 µs. 2.5 cm ALUMINUM DRIFT PLANE (0.3 mm)
Prototype with top removed.
DRIFT CAGE µPIC ALUMINUM VESSEL
(pressures up to 2 atm)
9.0 cm 3 2 . 8 c m n ABSORBER:
3He GAS
X (strips)
10 20 30 40 50 60
Relative clock pulse
5 10 15 20 25 30 35 40 45 50
Entries 28 Entries 28Position
X (strips)
10 20 30 40 50 60
Time-above-threshold (clocks)
5 10 15 20 25 30
Energy Deposition
µPIC
FPGA encoder 32 bits:
time, position, edge VME memory PC
Digital out (256 ch 2) VME bus 33-bit LVDS ( 2) Amplifier-Shaper-Discriminators External gate
Threshold Threshold
1
µPIC µPIC ASD ASD
DATA ENCODING
Two words per pulse. ‘edge bit’ saved with each data word.
Time-above-threshold (∝ energy deposit)
(ATLAS, KEK)
PROTON-TRITON TRACKS
Simultaneous measurement
deposit’ at high rates. Excellent background rejection capability.
Y (strips)
10 20 30 40 50 60
Relative clock pulse
5 10 15 20 25 30 35 40 45 50
Entries 29 Entries 29Position Y (strips)
10 20 30 40 50 60
Time-above-threshold (clocks)
5 10 15 20 25 30
Energy deposition
µPIC
FPGA encoder 32 bits:
time, position, edge VME memory PC
Digital out (256 ch 2) VME bus 33-bit LVDS ( 2) Amplifier-Shaper-Discriminators External gate
Threshold Threshold
1
µPIC µPIC ASD ASD
DATA ENCODING
Two words per pulse. ‘edge bit’ saved with each data word.
Time-above-threshold (∝ energy deposit)
(ATLAS, KEK)
PROTON-TRITON TRACKS
Simultaneous measurement
deposit’ at high rates. Excellent background rejection capability.
µPIC
FPGA encoder 32 bits:
time, position, edge VME memory PC
Digital out (256 ch 2) VME bus 33-bit LVDS ( 2) Amplifier-Shaper-Discriminators External gate
Threshold Threshold
1
µPIC µPIC ASD ASD
DATA ENCODING
Two words per pulse. ‘edge bit’ saved with each data word.
Time-above-threshold (∝ energy deposit)
X (strips)
10 20 30 40 50 60
Relative clock pulse
5 10 15 20 25 30 35 40 45 50
Entries 25 Entries 25Position
X (strips)
10 20 30 40 50 60
Time-above-threshold (clocks)
5 10 15 20 25 30
Energy Deposition
PROTON TRITON NEUTRON
(ATLAS, KEK)
PROTON-TRITON TRACKS
Simultaneous measurement
deposit’ at high rates. Excellent background rejection capability.
Materials and Life Science Facility (MLF)
J-PARC
Tokai, Ibaraki
Experiments in Nov. 2009, June 2010, and Feb. 2011. Beam power ~120 kW. Carried out at NOBORU beam line. Fill gas: Ar-C2H6-3He (63:7:30) at 2 atm, efficiencies ~28%(5 cm), ~13%(2.5 cm).
Moderator-to-detector distance of ~14.5 m.
25 Hz pulse rate, 10 Å band- width.
De Detect ector
position position
Rotary collimator Bandwidth chopper Adjustable B4C slits
NOBORU (BL10)
NOBORU BEAM LINE
SAMPLE HOLDER µNID
AMPLIFIER-SHAPER- DISCRIMINATORS (ASD) Prototype in experimental area at NOBORU.
Same gas filling used for first two experiments (separated by 8 months). No degradation in performance seen in June experiment. Gain recovered by increasing anode voltage. Detector remained operable after more than 1 year on single gas filling.
Time after filling Gain
(% of initial)
1st Exp (2009) 2nd Exp (2010) Dec 2010 0 months 100 8 months 67 13 months 30
Strategies to extend operation
Annealing of vessel and µPIC against outgassing. Careful selection of materials. Gas purification or 3He reclamation system.
Time-averaged data rates from 200 kHz ~ 9.4 MHz (neutron rate of 80~100 kHz). Large dead time (40 ~ 85%). Encoder limits DAQ rate. VME-to-PC transfer creates dead time. Limitations can be reduced with further hardware development. Reduction in incoming data means fewer VME readouts. Effectiveness depends on details of TOF distribution and gate. Useful for Bragg transmission, resonance absorption.
EXTERNAL TOF GATE
Time (ms)
10 20 30 40 50 60 70 80 90
100
Counts
10
210
310
40 ms Neutron pulses
Ungated TOF > 3 ms
Total time (min) Dead time (%)
8948 191389 34.5 226.2 82.7 43.6 ~70% decrease in measurement time.
Ex: Bragg transmission measurement (2010).
EXTERNAL TOF GATE
Both neutrons and gammas are detected (γ efficiency ~10-3). Neutrons selected by cuts in total time- above-threshold and 3D track length. Fraction of detected γ’s surviving neutron cuts < 10-6 (effective gamma sensitivity of < 10-9).
Escape events Fully-contained neutrons Event pile-up, scattered protons
Length (cm)
0.2 0.4 0.6 0.8 1 1.2 1.4 1.6
Time-above-threshold (clocks)
100 200 300 400 500 1 10
210
310
Time-above-threshold vs. Track length
n γ
Contamination fraction (95% CL)
Track length + PID
< 5.5 × 10⁻⁶ < 2.9 × 10⁻⁶
100 200 300 400 500
Counts/hr/3.75 clocks
1 2 3 4 5 6 7
137Cs
No source
‘Energy’ cut Background neutrons γ’s from
137 Cs
Pulse-width sum after track-length cut
Gamma rejection studied using RI sources. Data taken over 24 hours.
Cd TEST CHART
No PID With PID
Position from mid- point of track. Resolution: ~1 mm (σ) Resolution with PID: 349 ± 36 µm (σ) (Includes beam dispersion.)
Data taken at NOBORU, J-PARC in Nov. 2009.
5 cm 2 mm slits Preliminary
Y (strips)
10 20 30 40 50 60
Time-above-threshold (clocks)
5 10 15 20 25 30
Energy deposition
Proton direction from shape of distribution Mid-point Corrected position
Two methods: End-Point Extrapolation (EPE) and Peak Interpolation (PI). Combining both methods produces best result of σ = 118.4 ± 0.2 µm.
Data taken at NOBORU, J-PARC in Feb. 2011.
NO REFINEMENT (σ = 315 µm) EPE ONLY (σ = 182 µm) EPE + PI (σ = 118 µm)
Y (strips)
10 20 30 40 50 60
Time-above-threshold (clocks)
5 10 15 20 25 30
Energy deposition
Track length from extrapolation Track length from peaks
Pulse width
5 cm 0.5 mm slits Preliminary
IMAGING PLATE (200 MIN.) µPIC (29 MIN.)
Resolution 50~60 µm. Courtesy of Ohi, J-PARC. Preliminary
Bin size: 200 µm × 200 µm. Data taken at NOBORU, J-PARC in Feb. 2011 (µPIC).
Bin size can be decreased with higher statistics. Image processing techniques could improve image.
~3.5 cm
Resonance absorption. Bragg-edge transmission.
JPS Fall Meeting, Toyama University, 22 Sep 2011
Sheets of In, Ta, Ag, Mo, and Mn. Typical area of 10 cm × 10 cm. Thicknesses from 10 µm to 1 mm. Resonance absorption occurs when neutrons of a particular energy are absorbed preferentially by a target nucleus. Large samples to accumulate statistics quickly (~16 min/sample). Good time resolution and background rejection allows us to see resonances near beginning of pulse.
Time (ms)
0.1 0.2 0.3 0.4 0.5 0.6 0.7 0.8 0.9 1
Transmission
0.2 0.4 0.6 0.8 1
Mn Mo Ag Ta In
0.04 0.08 0.6 0.8 1
Preliminary
Time (ms)
0.5 0.6 0.7 0.8 0.9 1
Transmission
0.2 0.4 0.6 0.8 1
Preliminary Indium compared with ENDF/B-VII.0
Data taken at NOBORU, J-PARC in Feb. 2011.
Edges appear when neutron wavelength is twice crystal plane spacing (Bragg’s law at 2θ = 180º). Edge spacing is consistent with expected BCC crystal structure. Precise measurement of edge positions determines lattice parameter.
Data taken at NOBORU, J-PARC in Feb. 2011.
1.6 cm
Time (ms)
2 4 6 8 10 12 14 16 18
Transmission
0.15 0.2 0.25 0.3 0.35
(110) (200) (211) Preliminary
λ = 2 d110
Fe powder (> 99% purity, grain size < 325 µm).
Fe CRYSTAL STRUCTURE
Body-centered cubic (BCC)
a = dlmn
a is referred to as the lattice parameter.
78 × 40.5 × 10 mm3 TIG-WELDED 316L STAINLESS STEEL PLATE 19 mm 78 mm
) Å ( λ
1.5 2 2.5 3 3.5 4 4.5 5 5.5
Transmission
0.2 0.25 0.3 0.35 0.4 0.45 Transmission vs. neutron wavelength
Preliminary
(111) (200) (220) (311)
Weld area Steel plate 2 Steel plate 2
50 100 150 200 250 50 100 150 200 250 3.5 4 4.5 5 5.5 6 6.5
Welded steel plate (6 < TOF < 8 ms)
Preliminary Weld area
50 100 150 200 250 50 100 150 200 250 3.5 4 4.5 5 5.5
Welded steel plate (9 < TOF < 14 ms)
Preliminary Weld area
Edge spacing is consistent with FCC crystal structure.
Data taken at NOBORU, J-PARC in June 2010.
Variation in edge positions may be related to internal strain. Full strain tensor requires measurements from at least six independent directions. Only one direction observed in this measurement.
Data taken at NOBORU, J-PARC in June 2010.
x ( s t r i p s )
100 110 120 130 140 150 160
y (strips)
60 80 100 120 140 160 180
3.56 3.58 3.6 3.62
) Å Edge position (
(200)
Preliminary
Weld center-line
x (strips)
100 110 120 130 140 150 160
y (strips)
60 80 100 120 140 160 180
2.15 2.16 2.17 2.18
) Å Edge position (
(311)
Preliminary Divide image into 4.8 × 4.8 mm2 ‘pixels’ and fit edge positions*.
* Fit procedure based on Santisteban, et al. (2001)
d = λ 2
d-spacing from wavelength strain component in beam direction
ε = d − d0 d0
Optimization of gas mixture. Smaller pitch µPIC. New ASICs and encoder for more compact DAQ.
JPS Fall Meeting, Toyama University, 22 Sep 2011
Pressure
(atm)
Drift velocity
(µm/ns)
Transverse diffusion
(µm/cm1/2)
Longitudinal diffusion
(µm/cm1/2)
Expected improvement in resolution
Ar:C2H6:3He (63:7:30) Ar:C2H6:3He (63:7:30) Xe:C2H6:3He (50:20:30) Ar:CO2:3He (50:20:30)
2 23.1 273 169 (118 µm) 3 23.4 231 126 ~15% 2 29.4 183 125 ~15% 2 22.5 107 114 ~15%
Shorten p-t track lengths by increasing pressure or changing to gas with higher stopping power. Reduce diffusion of drift electrons. Moderate reductions in pixel pitch produce corresponding reduction in position resolution.
Gas parameters determined by MAGBOLTZ. Resolutions estimated with GEANT4.
400 µm
Denser packing of anode pixels
2 8 3 µ m 346 µm
µ‐PIC
CR board
To memory board
Replace ASDs with CMOS chips (developed with KEK for SMILE project). 16 channels/chip (increased from 4). Power per channel reduced by factor of more than 3.
4 mm
New CMOS ASIC
Combine CMOS chips with FPGA on single board. Four boards replace ASD racks, encoder, cables. Each board writes to memory, increasing max. data rate. New boards now under testing.
ASDs FPGA ENCODER
10-cm prototype in lab at Kyoto Univ.
~25 cm ~35 cm
Analog Signal 128ch Analog Data & Trig. Control
118mm × 220mm FPGA CMOS ASICS ADC
TPC based on micro-pattern gaseous detector and FPGA DAQ system.
Position resolution of 118 µm; time resolution of ~1 µs. FPGA-based DAQ with high data rates. Strong rejection of gammas and fast neutrons.
Detector remains operable over long time.
Annealing to reduce outgassing for increased long-term stability. Gas filtration system could extend operation considerably.
Development of compact DAQ and optimization of gas mixture are ongoing. µPIC manufactured using standard, inexpensive PC board manufacturing processes.
µPIC sizes up to 30 × 30 cm2 are currently available. Tiling of detectors to cover large area.