
SLIDE 1
Network Analysis to understand the Roman Commerce
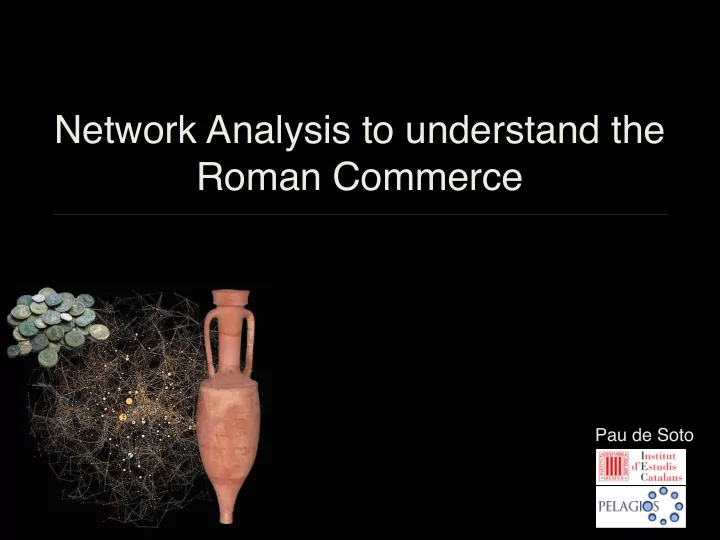
Pau de Soto
Network Analysis to understand the Roman Commerce Pau de Soto - - PowerPoint PPT Presentation
Network Analysis to understand the Roman Commerce Pau de Soto Network Analysis to understand the Roman Commerce Territory covering all the Roman Empire Mediterranean, from Northern Western Europe to Near and Middle East. Created NETWORK S
Pau de Soto
COHESION
Network Analysis to understand the Roman Commerce
Territory covering all the Mediterranean, from Northern Western Europe to Near and Middle East.
2
Created Maintained
NETWORK S
COHESION
Network Analysis to understand the Roman Commerce
3
Created Maintained
NETWORK S
All levels of Roman life Houses Client System Cities Politic System
Network Analysis to understand the Roman Commerce
4
NETWORK S
All levels of Roman life Houses Client System Cities Politic System Empire - Communication Systems
complex transport infrastructures put together a lot of communities Political, economical & social movement
Network Analysis to understand the Roman Commerce
5
The Project Objectives:
1) An approach to the Roman Transport Network Morphology 2) Reconstruction of the Roman Transportation Systems
political, social or economical interests?
Network Analysis to understand the Roman Commerce
P.
The Project Evolution:
To study all these networks it is mandatory to know how were the Roman Transport System.
Network Analysis to understand the Roman Commerce
Divided into:
Communications
Network Analysis to understand the Roman Commerce
Two wide spaces:
Oceanus)
Maximum support to the economy of Rome
Sea Transport
system
capacities
(Pirates) Rome understood the importance of the maritime navigation, specially in medium - long travels.
Network Analysis to understand the Roman Commerce Transport system with big duality: Downstream Upstream
Best way to penetrate in inland territories
River Transport
(upstreams)
Limitations:
Mediterranean)
(leeves)
Lots of Roman cities with river connections:
Network Analysis to understand the Roman Commerce
Only system that connect everyplace of the Empire
Land Transport
Empire
Rome built more than 300.000 kms of land routes.
truly empire.
cities and territories of the Roman Empire.
and propaganda functions.
Network Analysis to understand the Roman Commerce
The motivations for the construction of the transport network changed over the time.
colonies. Networks should cover all needs Over Time
needs.
motivations.
How to study the territorial configuration? How to analyse the commerce? How explain the movement of Roman goods? How get close to the mobility of the Romans? We know the infrastructures and the transportation systems… Digital Recording
Quantifying the Roman Transport System
Digitalizing
Network Analysis to understand the Roman Commerce
Network Analysis Transform the reality in nodes (points) and edges (lines) Transform cities into nodes (points) and routes into edges (lines)
Origin: Graphs Theory by L. Eulen (1736)
Koningsberg
VALUES Calculations
Social Network Analysis
Transport
Methodology: Use all available data to obtain the most accurate reconstruction of the Roman Roads, navigable rivers and sea connections:
Quantifying the Roman Transport System
Digitalizing
Archaeological data:
– Mansiones. – Milestones. – Stretches of roads. – Villae and rural settlements. – Necropoli, Roman cemeteries – Bridges, …
Geographic Reality: − Mountains − River steps Historical & Ethnographical Data: − Medieval - XIXth Cent.
Network Analysis to understand the Roman Commerce
Result: High detailed transport network.
Network Analysis to understand the Roman Commerce
Acessibility Main concept: Cities with higher connectivity More important settlements = Connectivity Political, economic and social significance
Degree Centrality: Betweenness Centrality: Closeness Centrality:
Network Analysis to understand the Roman Commerce
Calculating the Accessibility Accessibility = Centrality: More intuitive, simple More connections = More important
Network Analysis to understand the Roman Commerce
Calculating the Accessibility Origin in Social Network Analysis # edge = # value
Sea Transport 1 River Transport 2 Land (Main Road) 3 Land (Secondary R.) 4
New method of calculation
1 sea 3,4 river (downstream) 6,8 river (upstream) 43,4 land (wagon) 50,7 land (donkey)
Value of edges depending on the type of transport
Network Analysis to understand the Roman Commerce
Calculating the Accessibility
Network Analysis to understand the Roman Commerce
The accessibility results shows us the network configuration in each territory in a specific historical moment. Accessibility Different periods
Roman Times (s. II AD) XVIth Century
Higher values (red/ yellow) show territories well connected Important cities and territories
Network Analysis to understand the Roman Commerce
Accessibility - Hispania
Transport infrastructures were developed following the geography, natural resources (mines) and military settlements.
Rome was interested in fully exploit the coast areas and the closer locations in the river valleys.
Network Analysis to understand the Roman Commerce
Accessibility - Italy Rome built her land routes thinking in a political and military connections Rome was perfectly connected with the rest of the Empire
Network Analysis to understand the Roman Commerce
Accessibility - Britannia
Armies in Britannia Optimize the metropolis-colony connections. London was the centre of the transport network.
HOW? Implement of constant values per kilometre Cost & Time
✓
the shortest.
✓
the most economical.
✓
the faster. Best Route
Network Analysis to understand the Roman Commerce
Once we know the length of each trip we can use constant values. Methodology to import values. Introducing cost & time values
Cost of travel:
−
The length of the trip
−
The Costs of transports:
−
The characteristics of vehicles
−
The load capacities
−
Roman prices
Time of travel:
−
The length of the trip
−
The speed of vehicles
T(time) = L(length) / Sv (speed value) C(cost) = L(length) * Cv (cost value)
Mule driver, camel driver with maintenance......................25 modii Water carrier working a full day with maintenance............25 modii
Network Analysis to understand the Roman Commerce
Based on classical sources and archaeology: Values
1 sea 3,4 river (downstream) 6,8 river (upstream) 43,4 land (wagon) 50,7 land (donkey)
Network Analysis to understand the Roman Commerce
The values of speeds and costs are entered into the GIS as constant values for each kilometre in route. Introducing the Values new tables 1 Each section has its own cost & time
Network Analysis to understand the Roman Commerce
Finally we can calculate the transport costs & times from
network
Closer view to the mobility of the transport systems. Time Ancient sources = temporal patterns / not distances The travels were counted in days and not in numbers of miles travelled.
“Go, my little book, go; accompany my Flaccus across the wide, but propitious, waters of the deep, and with unobstructed course, and favouring winds, reach the towers of Hispanian Tarragona. Thence a chariot will take you, and, carried swiftly along, you will see the lofty Bilbilis, and your dear Salo at the fifth stage…”
Knowing the time needed to travel is a important information to understand the distribution of certain products, especially those of low durability.
Network Analysis to understand the Roman Commerce
Time
Network Analysis to understand the Roman Commerce
Time
Network Analysis to understand the Roman Commerce
It is the analysis of the movement of goods from its transportation cost. Costs The goods were moved until their price was prohibitive for commercialization Observe cost patterns and influential areas of distribution
Network Analysis to understand the Roman Commerce
Objective: Not replicate one single travel cost
Network Analysis to understand the Roman Commerce
Costs Firsts analysis in NE - Hispanic
Accessibility - Hispania The territories more accessible were always near the coast or in areas with river connections. Inside peninsula was heavily
archaeological data that is documented in inland sites.
Network Analysis to understand the Roman Commerce
Network Analysis to understand the Roman Commerce
Accessibility - Italy From Arezzo, the natural way to export was the Tyrrhenian Sea coast. Many coastal territories were easily accessible. There were important commercial ports
Network Analysis to understand the Roman Commerce
Accessibility - Britannia Except for points near the coast, many of hinterland were isolated. This situation is especially prominent in the northern territories. London represented a good redistribution point of goods both export and import
Network Analysis to understand the Roman Commerce
The Roman Empire was based on a highly organised economical and political communication network. Initially, the routes especially by land, were designed according to military and political criteria to link territories related to Rome. The organisation of territories was made taking into account the advantages of geography, building cities along the coast and in easily accessible river valleys. The model of communication in Italy was very different from Hispania and Britannia. The Italian model was configured in a long time, and did not respond especially to an economical criteria. Hispania and Britannia were seen as models of land exploitation.
Conclusions The Roman Empire
Network Analysis to understand the Roman Commerce
The study of the Roman transport network is very necessary to understand the roman economy and history. The transportation network in Roman Times was indispensable to keep together the territories with such heterogeneous cultural background. The political integration required integration in terms of economy and communication. The transport network was a key factor in the success of the Roman Empire.
Conclusions The Roman Empire
Network Analysis to understand the Roman Commerce
It is an unfinished project. But it can shows some interesting results. It provides new data to the study of economics and history
The Network Analysis provides us new information on past transport conditions to better understand past economies. A more complete study of the whole network, province by province, is required to understand all the Roman transport system. GIS is an exceptional tool for modelling transport and accessibility
Conclusions Project Wider territories More detailed
Network Analysis to understand the Roman Commerce