
SLIDE 1
Roa
- ad sa
safe fety ty per erform formanc ance e in in Ne New w Zea eala land nd
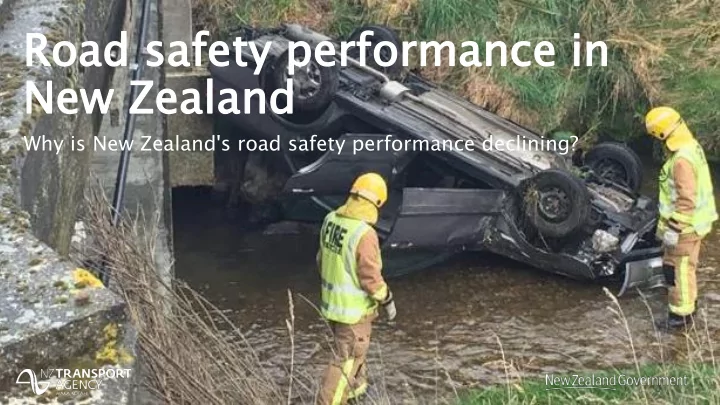
Why is New Zealand's road safety performance declining?
Ne New w Zea eala land nd Why is New Zealand's road safety - - PowerPoint PPT Presentation
Roa oad sa safe fety ty per erform formanc ance e in in Ne New w Zea eala land nd Why is New Zealand's road safety performance declining? Is our sy syst stem em safe? fe? Ten years ago 95,000 km of roads 94,000 km of
Why is New Zealand's road safety performance declining?
travelled
Ten years ago
travelled
100 200 300 400 500 Mar-14 Mar-15 Mar-16 Mar-17 Mar-18
2008 to 2013
(253) in 2013
100 200 300 400 500 2008 2009 2010 2011 2012 2013 2014 2015 2016 2017 2018
+55%
injuries (DSIs) +40%
+10%
+39%
1000 2000 3000 4000 5000 6000 Mar-14 Mar-15 Mar-16 Mar-17 Mar-18
persons killed in road crashes deaths and serious injuries hospitalised >1 day ACC entitlement claims
500 1000 1500
>75yrs 16-24yrs cyc/ped m/cycle passengers drivers 2017 2016 2015 Killed or seriously injured
100 200 300 400 500 600 700 800 900 Nthland Auckland Waikato BayPlenty Gisborne HawkesBay Taranaki 2015/16 2016/17 2017/18
20 40 60 80 100 120 140 Nthland Auckland Waikato BayPlenty Gisborne HawkesBay Taranaki 2015/16 2016/17 2017/18
Deaths and serious injuries, per 100,000 population
20 40 60 80 100 120 140 160 180 Man-Wang Wellington Nel-Mar-Tas Canterbury WestCoast Otago Sthland 2015/16 2016/17 2017/18
Deaths and serious injuries, per 100,000 population
numbers of vehicles and increasing travel, the number of crashes on the network would be expected to increase*
increasing at a faster rate than can be explained by simple traffic growth
+14%
+17%
travelled +10%
+8%
900 1000 1100 1200 1300 1400 1500 Dec-13 Dec-14 Dec-15 Dec-16 Dec-17
Population and fleet trends, indexed to 2013=1000
persons killed in road crashes cars all vehicles veh kms travelled population deaths and serious injuries
+55%
+40%
900 1000 1100 1200 1300 1400 1500 Dec-13 Dec-14 Dec-15 Dec-16 Dec-17
Population and fleet trends, indexed to 2013=1000
persons killed in road crashes cars all vehicles veh kms travelled population deaths and serious injuries
factors which lead to crashes –
which lead to fatal and serious injuries in those crashes
If there are severity-increasing influences, deaths and injuries will increase .
In 2013-2017
100 200 300 400 500 600 Dec-13 Jun-14 Dec-14 Jun-15 Dec-15 Jun-16 Dec-16 Jun-17
108,000 more trucks 215 million more SH vkt 12,000 more heavy trucks
129,000 458,000 2039 M
In 50km/h zones, 16% of crashes were fatal/serious
0% 2% 4% 6% 8% 10% 90 92 94 96 98 100 Sep-13 Sep-14 Sep-15 Sep-16 Sep-17 Speed on 100 km/h roads: behaviour and enforcement
average open road speed vehicles detected speeding in 100 km/h zones
64000 68000 72000 76000 80000 84000 Sep-13 Sep-14 Sep-15 Sep-16 Sep-17
Licensed motorcycles and mopeds 8000 more motorcycles
0% 10% 20% 30% 40% 50% 60% 70% Sep-13 Sep-14 Sep-15 Sep-16 Sep-17
Percentage of occupant fatalities in older vehicles
half of all occupant fatalities in vehicles more than 15 years old
0% 10% 20% 30% 40% 50% 60% 1 Star 2 Star 3 Star 4 Star 5 Star % fleet % driver DSI
and the severity of crashes is influenced by
crash numbers are influenced by
20 40 60 80 100 120 Dec-12 Dec-13 Dec-14 Dec-15 Dec-16 Dec-17
Vehicle occupants killed not wearing seatbelts
To build a safe road system free of death and serious injury
features)
In a safe system, people should not be seriously injured or killed as a result of someone’s mistake. The four pillars: Safe Roads and roadsides, Safe Vehicles, Safe Users, Safe Speeds The principles: people make mistakes, people are vulnerable, all parts of the system are needed, shared responsibility