NASA Applied Sciences Disasters Program Support Timeline for - - PowerPoint PPT Presentation

nasa applied sciences disasters program support timeline
SMART_READER_LITE
LIVE PREVIEW

NASA Applied Sciences Disasters Program Support Timeline for - - PowerPoint PPT Presentation

NASA Applied Sciences Disasters Program Support Timeline for Historic Louisiana Floods 
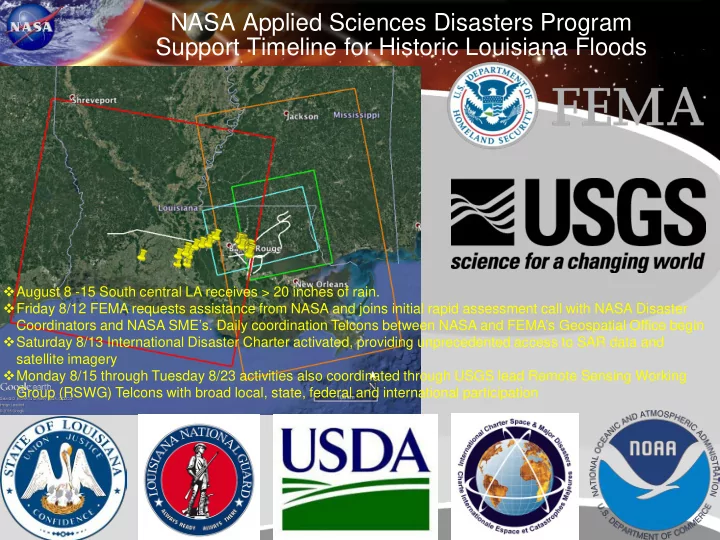
August 8 -15 South central LA receives > 20 inches of rain. Friday 8/12 FEMA requests assistance from NASA and joins initial rapid assessment call


slide-1
SLIDE 1

August 8 -15 South central LA receives > 20 inches of rain. Friday 8/12 FEMA requests assistance from NASA and joins initial rapid assessment call with NASA Disaster Coordinators and NASA SME’s. Daily coordination Telcons between NASA and FEMA’s Geospatial Office begin Saturday 8/13 International Disaster Charter activated, providing unprecedented access to SAR data and satellite imagery Monday 8/15 through Tuesday 8/23 activities also coordinated through USGS lead Remote Sensing Working Group (RSWG) Telcons with broad local, state, federal and international participation

NASA Applied Sciences Disasters Program Support Timeline for Historic Louisiana Floods

slide-2
SLIDE 2

2

NASA Observes Historic Rainfall in Louisiana

NASA's IMERG data from Aug. 8 to Aug. 15, 2016 showed over 20 inches (508 mm) of rainfall was estimated in large areas of southeastern Louisiana and extreme southern Mississippi. Even greater rainfall totals of 30 inches (762 mm) were indicated in a small area of Louisiana west of Lake Pontchartrain. Credits: NASA/JAXA, Hal Pierce

slide-3
SLIDE 3

NASA Global Precipitation Mission – GPM IMERG

3

NASA's IMERG data from Aug. 8 to Aug. 15, 2016 showed over 20 inches (508 mm) of rainfall was estimated in large areas of southeastern Louisiana and extreme southern Mississippi. Even greater rainfall totals of 30 inches (762 mm) were indicated in a small area of Louisiana west of Lake Pontchartrain. Credits: NASA/JAXA, Hal Pierce

slide-4
SLIDE 4

Satellite precipitation estimates merged via the GPM product are utilized as a key Input into the Global Flood Monitoring System (GFMS) utilizing land surface and routing models at 12 and 1 km resolution to estimate the occurrence and intensity of floods. The hydrological calculations are extended into the future (out to five days) using GEOS-5 rainfall predictions. During the Louisiana floods in August GFMS images and data were provided showing large-scale current conditions and forecasts as in upper left image (3-hr resolution). The forecasts were used by FEMA to help plan their response. The 1-km resolution inundation estimates from GFMS (example in lower left) were downloaded by FEMA and used to estimate number

  • f

structures and homes

  • impacted. The GFMS inundation estimates were also used

to compare with those from optical and SAR data, when available (see above).

Global Flood Mapping System – GFMS

4

Flood Detection/Intensity (Depth above Threshold [mm]) 14 August 2016 Inundation Estimation (1 km) 13 August 2016

VIIRS-based Inundation Estimate GFMS-based Inundation Estimate

Global Flood Monitoring System (GFMS) Adler/Wu University of Maryland

Credit: Bob Adler and Huan WU, UMD

slide-5
SLIDE 5

NPP Suomi VIIRS Flood Maps

5

Overview of flooding near Baton Rouge using VIIRS 30-m flood map composited from August 15 and August 17, 2016. Light purple is water.

August 15-17, 2016 VIRRS Flood maps courtesy of Sanmei Li, GMU.

slide-6
SLIDE 6

NASA Hyperion (EO-1) Imagery

6

August 16, 2016 15m EO-1 imagery courtesy of Stu Frye, NASA GSFC.

slide-7
SLIDE 7

ISS Handheld Digital Camera Photography

Amite R. Baton Rouge, LA ISS048-E-65146 Acquired 08.23.16 500 mm lens

  • ISS USOS crew acquired imagery of

flooding area on Aug 16, 17, 23 in response to target requests from JSC Crew Earth Observations ops team (example of targeting information above)

  • Downlinked imagery reviewed and

manually georeferenced prior to delivery to USGS HDDS team

  • Data potentially useful for validation of

SAR and flood extent model products

Credit: Will Stefanov, NASA JSC

slide-8
SLIDE 8

8

NASA GSFC Disaster Team utilized a new algorithm for producing night time

  • ptical data, which was used as one of

the assets for assessing impact of the Louisiana floods at the request of FEMA. In this case, the data was used for determining power outages as a means of mapping impact zones. (NASA Direct Readout Lab). Top-L: During flood event, Aug 15th, 2016; Bottom-L: Before event, May 7th, 2016. A similar product developed by NASA MSFC to difference images such as these was first provided by NASA Disasters to DHS/FEMA to support efforts to restore power after Hurricane Sandy.

VIIRS DNB Image During Flood Event, August 15th, 2016 Image Before Flooding, May 7th, 2016

Suomi NPP VIIRS Day-Night Band Detects Power Outages

Credit: Dalia Kirschbaum and Miguel Roman, NASA GSFC

slide-9
SLIDE 9

NASA Coordinates Synchronized Space-Air-Ground Observations for Historic Floods in Louisiana

ALOS–2 Sentinel–1A COSMO-SkyMed RADARSAT–2 NOAA USGS

Photo: Dennis K. Demcheck, U.S. Geological Survey

JPL coordinated synchronized

  • bservations of spaceborne SAR

sensors, high-resolution airborne optical sensor, and field crews on the ground.

slide-10
SLIDE 10

NOAA 4-band Aerial Image Red Pixels: ARIA Flood Proxy Map Yellow Pushpins: USGS Water Edge

Flooded vegetation Open water flood

Small Number of Ground Observations Calibrate a Wide Swath Flood Map Derived from Satellite SAR Data

slide-11
SLIDE 11

Satellite SAR Data Validate Well with Ground Observations

Red Pixels: ARIA Flood Proxy Map Yellow Pushpins: USGS Water Edge Positions

Photo: Dennis K. Demcheck, U.S. Geological Survey

A A B B C C D D E E

slide-12
SLIDE 12

Questions?

12