
SLIDE 1
1
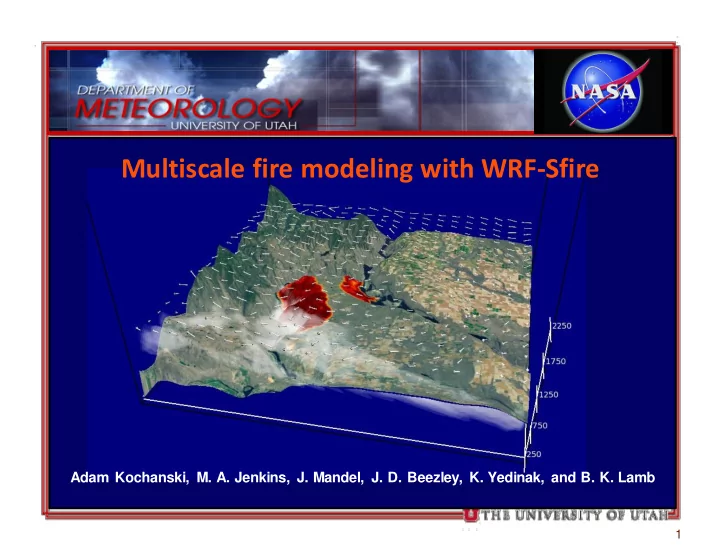
Multiscale fire modeling with WRF-Sfire
Adam Kochanski, M. A. Jenkins, J. Mandel, J. D. Beezley, K. Yedinak, and B. K. Lamb
Multiscale fire modeling with WRF-Sfire Adam Kochanski, M. A. - - PowerPoint PPT Presentation
Multiscale fire modeling with WRF-Sfire Adam Kochanski, M. A. Jenkins, J. Mandel, J. D. Beezley, K. Yedinak, and B. K. Lamb 1 Introduction Outline: Range of scales associated with wildland fires Modeling of Fire-Atmosphere interactions
1
Adam Kochanski, M. A. Jenkins, J. Mandel, J. D. Beezley, K. Yedinak, and B. K. Lamb
2
Outline:
framework
2
3
Global weather model Mesoscale weather model Large Eddy Simulator (LES)
FDS
1 m 10 cm
Wildland Fires Flames Flamelets Structural Fires
boundary conditions boundary conditions boundary conditions
Range of scales that WRF
3
4
4 DATA
5
FireFlux picture from Clements et al. 2008
MT ST
5
6 6
7
4 [m/s] 12 [m/s] 6 [g/kg] 12 [g/kg]
Visualization by Bedrich Sousedik
8
in-plume concentration ~3000μg /m3 (3mg/m3)
9
3200m
w (m/s)
MAIN TOWER SHORT TOWER
10
11
12
13
14
15
Downdrafts ahead of the fire front Main tower Short tower
16
Main Tower Short Tower
Horizontal Wind Speed Vertical Wind Speed z-vorticity (rotation) Horizontal divergence
17 Horizontal Wind Speed Vertical Wind Speed
Main Tower Short Tower
18
19
20
20
WRF framework (atmosphere)
Fire Spread Model:
the level set method Fuel Moisture Model
changes in T and RH
Fire Emission Model: Emission of a passive scalar or chemical fluxes HEAT AND MOISTURE FUEL MOISTURE
METEO INPUT DATA
AIR TEMPERATURE RELATIVE HUMIDITY PRECIPITATION LOCAL WINDS High-resolution fire forecast:
Standard weather forecast
METEO OUTPUT FIRE OUTPUT
FIRE INPUT DATA
FLUXES OF TRACER OR CHEMICAL SPECIES
21
21
Integrating WRF-Fire with WRF-Chem allows for a representation of interesting fire-atmosphere interactions (aerosols and radiation)
Albini Fuel Categories (13) MODIS Land Cover Types:
tracer1 tracer2 tracer3 tracer4 tracer5 tracer6 tracer7 tracer8
CONCENTRATION OF PASSIVE TRACERS:
Fuel consumption rates user-define emission factors for a tracer Emission of tracers
No chemistry
Simplified approach – no chemistry fast
Simplified approach – no chemistry 96h simulation done in 12h 52min
forecast ready in 3h 13min
23
in-plume concentration ~3000μg /m3 (3mg/m3)
Simplified approach – no chemistry 96h simulation done in 12h 52min
forecast ready in 3h 13min
Simulated fire perimeter Observed fire perimeter
24
in-plume concentration ~3000μg /m3 (3mg/m3)
Fuel Moisture
25
in-plume concentration ~3000μg /m3 (3mg/m3) 2.0% 4.0% 6.0% 8.0% 10.0% 12.0% 14.0% 16.0% 18.0% 20.0% 22.0% 5000 10000 15000 20000 25000 30000 35000 40000 45000 50000
12 24 36 48 60 72 84 96 Fuel moisture Fire area (ha) Time since 09.09.2012 00:00 local (h)
Simulated fire area and fuel moisture
Simulated fire area Observed fire area Integrated fuel moisture simulated by the fuel moisture model
26
in-plume concentration ~3000μg /m3 (3mg/m3)
Braker Canyon fire (WA): diurnal variations in weather conditions translate into highly variable plume height and smoke dispersion
27
in-plume concentration ~3000μg /m3 (3mg/m3) 500 1000 1500 2000 2500 3000 3500 4000 4500 500 1000 1500 2000 2500 3000 3500 4000 4500 10 20 30 40 50 60 Eleva on (m) Plume height ASL (m) Distance from
MISR plume height WRF-SFIRE plume height Eleva on
Domain setup: D01 151x127x37 D02 184x142x37 D03 406x283x37 D04 712x364x37 D05 196x193x37 Time step: 120s, 40s, 13.3s 4.44s 1.48s
Albini Fuel Categories (13) MODIS Land Cover Types:
RADM2
ald csl eth hc3 hc5 hcho iso ket mgly
tol xyl co no no2 so2 nh3 pm25i pm25j
bc1 bc2
NMOC:
MOZART
co ch4 h2 no no2 so2 nh3 p25
bc1 bc2 bigalk bigene c10h16 c2h4 c3h5oh c2h6 c3h6 c3h8 ch3cooh ch3oh cres glyald hyac isop macr mek mvk tol
NMOC:
Fuel consumption rates FINN emission factors Emission of chemical species Conversion from MOZART to RADM2
29
48h WSFC simulation with MOZART chemistry took 29h 56min on 324 CPUs First 24h forecast ready in 15h (3 times longer than passive racer)
30
time 10.22.2007 05:00 local time 10.22.2007 20:00 local time 10.23.2007 15:00 local time
Observed fire area WRF-fire area
31
in-plume concentration ~3000μg /m3 (3mg/m3)
32
in-plume concentration ~3000μg /m3 (3mg/m3)
33
33
max wind speed 32 m/s max wind speed 32 m/s
34
in-plume concentration ~3000μg /m3 (3mg/m3) Very dry and and windy conditions
during 2007 Santa Ana fires lead to almost no diurnal variability in the plume height and smoke dispersion
35
in-plume concentration ~3000μg /m3 (3mg/m3)
36
in-plume concentration ~3000μg /m3 (3mg/m3)
100 200 300 400 500 600 700 6 12 18 24 30 36 42 48 54 PM2.5 (ug/m3) Time (hr) since 10.21.200 12:00 UTC (05:00 local)
Observa ons (Escondido) WRF-SFIRE-CHEM WRF hourly average
Simulated vs. observed PM2.5 for Escondido
37
in-plume concentration ~3000μg /m3 (3mg/m3)
5 10 15 20 25 30 35 40 45 50 55 60 65 70 75 6 12 18 24 30 36 42 48 Simulated O3 (ppb) Observed O3 (ppb) Time (hr) since 10.21.2007 12:00 UTC (05:00 local)
Observa ons (Escondido) WRF-SFIRE-CHEM WRF hourly average
well as realistic simulations of wildland fires
interpretation of the measurement data and gaining a “bigger picture”
simplified representation of the fire smoke as a passive tracer, or as a mixture of chemically active species (coupling with WRF- Chem)
parameterization
variations in fire activity and smoke emissions
so its does not increases computational cost significantly
38
as the fire heat release will be only as good as the fire spread simulation
dependent, so at coarse horizontal resolutions a ‘bridge’ parameterization may be needed to handle sub-grid scale plumes
fire heat release, injection height and the emissions. The perfect validation dataset would require in-situ simultaneous measurements of the fire and plume properties, as well as the chemical fluxes and meteorology
39
40
Rate
spread Heat release
go to: http://www.openwfm.org/wiki/SFIRE to get the code, installation instructions and documentation