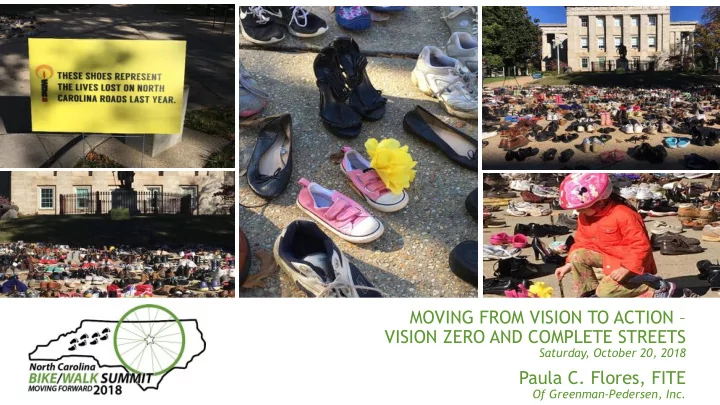
SLIDE 1 MOVING FROM VISION TO ACTION – VISION ZERO AND COMPLETE STREETS
Saturday, October 20, 2018
Paula C. Flores, FITE
Of Greenman-Pedersen, Inc.
SLIDE 2
- VISION ZERO OVERVIEW
- ENGINEERING – ONE OF THE 6E’S
- COMPLETE STREETS & DESIGN GUIDANCE
- CALL TO ACTION
SLIDE 3 “…obesity, inactivity, depression, and loss of community has not ‘happened’ to us; rather we legislated, subsidized, and planned it.” HEALTH CRISIS
- Dannenberg et al. 2012 Making Healthy Places.
SLIDE 4
Traffic violence is a public health crisis!
SLIDE 5
VISION ZERO OVERVIEW
SLIDE 6 Source: National Safety Council
NATIONAL TRENDS
SLIDE 7 Source: National Safety Council
NATIONAL TRENDS 2016 Motor Vehicle Crash Highlights 40,327 Fatalities 4.6 Million Injuries $416.2 Billion in societal costs
the population of a small city — are needlessly killed on American streets every year!
SLIDE 8
NATIONAL TRENDS
SLIDE 9 On average,
dying on Hillsborough Streets every day!
SLIDE 10 HUMANIZE THESE DEATHS
Eugene Fischer, 65 Ernest Kelly, 12 Emily Lopez, 17 LaMour Welch, 29
SLIDE 11
HUMANIZE THESE DEATHS
SLIDE 12 Source: NHTSA Fatality Analysis Reporting System
Pedestrian fatalities increase from 2007-2016, While all other traffic deaths decrease by 14%
NATIONAL TRENDS
SLIDE 13 Source: Future of Transportation National Survey (2010)
WHAT IS VISION ZERO?
Source: Vision Zero Network
- Acknowledges traffic losses are preventable
- Takes systems approach to prevention
- Is data-driven
- Addresses all road users
- Engages diverse, critical stakeholders
- Brings new URGENCY!
SLIDE 14 WHAT IS VISION ZERO?
Source: Vision Zero Network
SLIDE 15
ZERO IS THE RIGHT GOAL
SLIDE 16
ZERO IS THE RIGHT GOAL
SLIDE 17 ZERO IS THE RIGHT GOAL
- Leadership is Essential
- Not all E’s are created equal
- Speed matters most
- Data = Knowledge
SLIDE 18 SPEED TAKES THE BACK SEAT
Source: FHWA Achieving Multimodal Networks
SLIDE 19
Speed Matters Most
SPEED MATTERS MOST
SLIDE 20 Speed Matters Most
SPEED LIMIT REDUCTION RESULTS
NYC
- 14% in crashes
- 49% in pedestrian crashes
- 42% in bicyclist crashes
Seattle
- 40% in crashes
- 30% in injury crashes
Mexico City
SLIDE 21
- Speeding kills more than 10,000/year
- On par with drunk driving
- Doesn’t carry the same social consequences
- 30% of all fatal crashes nationwide
- Societal cost = $40 Billion annually
- National problem, effective solutions must
be applied locally
MANAGING SPEED
SLIDE 22 How is Vision Zero different?
“Vision Zero is a new approach in the U.S., and as such, “business as usual” will not get us to zero. We need City processes, partnerships, and laws to prioritize traffic safety and allow for systematic change.”
Source: Denver Vision Zero Action Plan
SLIDE 23
VISION ZERO ACTION PLANS
SLIDE 24
THE 6TH E - EQUITY
EQUALITY EQUITY
SLIDE 25
- Low income
- Minority
- Elderly /
Young
- Persons with disabilities
- Limited English proficiency
TRANSPORTATION EQUITY UNDERSERVED GROUPS
SLIDE 26
- 24% of Americans live in poverty w/ no car
- Work outside traditional 9-5pm hours
- More likely to travel by bike
- Less likely to practice safe bicycling
techniques
- More likely to walk on roads lacking safe,
accessible facilities
TRANSPORTATION EQUITY UNDERSERVED GROUPS
SLIDE 27
TRANSPORTATION EQUITY
DID YOU KNOW…
90 % 49 %
COMMUNITIES WITH SIDEWALKS
SLIDE 28
TRANSPORTATION EQUITY
Walking & Bicycling to Work by Household Income
SLIDE 29
Why would anyone do this?
TRANSPORTATION EQUITY
SLIDE 30
Why would anyone do this?
TRANSPORTATION EQUITY
SLIDE 31 Source: National Highway Traffic Safety Administration, 2012
SLIDE 32
TRANSPORTATION EQUITY
If we are not designing for all people of different ages and abilities… we are doing something wrong!
SLIDE 33 VZ Lessons Learned - US
LEADERSHIP, COLLABORATION, & ACCOUNTABILITY
- Early, strong, and consistent leadership
- Systemic change is not easy
- Change doesn’t occur over night
SLIDE 34 VZ Lessons Learned - US
FOCUS ON SYSTEM-LEVEL CHANGES
- Shift from traditional educational approach
aimed at individual behavior
- Embrace “upstream” approach to shape -
policies, systems, and the built environment
- Focus on key factors that affect people’s
behavior and choices
SLIDE 35 VZ Lessons Learned - US
COMMIT TO SPEED MANAGEMENT
- not simply a strategy or an optional tool
- it is fundamental and critical
SLIDE 36 MEASURE AND REPORT REGULARLY
PRIORITIZE COMMUNITY ENGAGEMENT
- prioritizing equity considerations early and
regularly
VZ Lessons Learned - US
SLIDE 37 *Survey of 1,089 people aged 15-20 – www.victoriawalks.org.au/young_people/
NATIONAL TRENDS
SLIDE 38 want more transportation
freedom to choose
Source: Future of Transportation National Survey (2010)
66 % 73 %
currently feel they have no choice but to drive
AMERICANS WANT CHOICES
Source: Future of Transportation National Survey (2010)
SLIDE 39 Don’t drive due to age, ability, or economic status
Source: Future of Transportation National Survey (2010)
33 % 57 %
Want to spend less time in the car
AMERICANS WANT CHOICES
SLIDE 40 Are Driven
33 % 57 %
Less than 3 miles
TREMENDOUS POTENTIAL
57 %
Less than 1 mile OF ALL HOUSEHOLD TRIPS:
Source: National Household Travel Survey (2009)
SLIDE 41 People Favor Safer Designs
US adults favor safer street design for walking even if driving is slower…
80 %
Source: CDC – Creating Walkable Communities: Understanding Trade-offs, August 2018
SLIDE 42 Source: USDOT/NHTSA
SLIDE 43 STREETS ARE INADEQUATE
- No sidewalks
- Too dangerous to cross on
foot
Source: Smart Growth America / National Complete Streets Coalition
SLIDE 44 STREETS ARE INADEQUATE
- No room for people
- No sidewalks
- Too dangerous to cross
Source: Smart Growth America / National Complete Streets Coalition
SLIDE 45 STREETS ARE INADEQUATE
- Inaccessible for wheelchair
users
Source: Smart Growth America / National Complete Streets Coalition
SLIDE 46 STREETS ARE INADEQUATE
- Uninviting for bus riders
Source: Smart Growth America / National Complete Streets Coalition
SLIDE 47 STREETS ARE INADEQUATE
bicycles
Source: Smart Growth America / National Complete Streets Coalition
SLIDE 48 STREETS ARE INADEQUATE
- Traffic jams
- Too many crashes
Source: Smart Growth America / National Complete Streets Coalition
SLIDE 49 STREETS ARE INADEQUATE
A typical state-owned arterial in suburbs - Wide, straight lanes make speeding more likely.
Source: Photo by T4America
SLIDE 50 SAFETY OVER SPEED
In fact… most of our streets were not built with people in mind!
SLIDE 51 SAFETY OVER SPEED
In fact… most of our streets were built for cars
SLIDE 52 ENGINEERING ONE OF THE 5E’s
6
- Plan
- Design
- Engineering
- Construction
- Operations
SLIDE 53
1ST PRIORITY - PEOPLE
SLIDE 54
REDESIGN FOR PEOPLE SPEED
SLIDE 55 MODE PRIORITY - HIERARCHY
DEGREE OF SUSTAINABILIT Y
SLIDE 56 WHAT ARE COMPLETE STREETS
Streets are for everyone, no matter who they are or how they travel!
SLIDE 57
WHAT ARE COMPLETE STREETS
SAFE COMFORTABLE CONVENIENT
SLIDE 58 FOR ALL USERS, OF ALL ABILITIES
Source: Image by Elena Streinikova
SLIDE 59
PEOPLE – MOVING CAPACITY
SLIDE 60
(persons per hour, per lane, per direction)
PEOPLE – MOVING CAPACITY
SLIDE 61
HOW DO WE TRANSFORM OUR STREETS?
SLIDE 62
HOW DO WE TRANSFORM OUR STREETS?
SLIDE 63
DESIGN GUIDES
…to change the practice and agency norms
SLIDE 64
Vehicle vs. Control Vehicle
- Design Speed vs. Posted Speed vs.
Target Speed
= Create self-enforcing streets through design
CONTEXT BASED DESIGN CONTROLS
AFFECTS:
- stopping sight distance
- passing sight distance
- median width
- radius/curves
- lateral clearances
- clear zones
- acceleration/deceleration lane
need and length
SLIDE 65 ACTIVE SPEED MANAGEMENT TOOLS
- Roundabouts
- Road Diets
- Lateral shifts or narrowing
- Curb extensions
- Center islands
- Smaller curb radii
- Eliminate free-flow channelized right turn
lanes
DESIGN GUIDES
…to change the practice and agency norms
SLIDE 66
- Lack of funding
- Liability and Risk
- Safety Concerns with Narrow lanes
Resistance to change
SLIDE 67 LACK OF FUNDING
Resistance to change
- Shift priorities away from an all roads
approach
- Institutionalize “complete streets” process
- Increase funding for transit, walkability,
biking
- Prioritize public investments in walkability
- Local commitments & Public-private
partnerships
SLIDE 68
substantial flexibility
- allows range of 9-foot to 12-foot
travel lanes
- 10-foot lanes are allowed in low
speed (<45MPH) environments
NARROW TRAVEL LANES
Resistance to change
SLIDE 69 Prius
5.8’
Pickup
6.6’
Bus
8-9’
Stabilizers 12-16’
Ladder Truck
7-8’
SP SPACE E MY MYTH - The Cars in MY City are Huge!
SLIDE 70
- One who deviates from established
design criteria (guidance) is not negligent
- follow and document a clear
process using engineering judgement
LIABILITY AND RISK
Resistance to change
SLIDE 71
- Lane widths
- Design vehicle
- Effective Curb Radii
- Speed of turning vehicle
- Pedestrian Crossing Distances
- Medians
- Channelized Right Turns
DESIGN FLEXABILITY
SLIDE 72
DESIGN GUIDES
…to change the practice and agency norms
SLIDE 73 DESIGN GUIDES
…to change the practice and agency norms
- New - NACTO Autonomous Urbanism
NACTO – National Association City Transportation Officials
SLIDE 74
DESIGN GUIDES
…to change the practice and agency norms
SLIDE 75 Source: Taras Grescoe @grescoe
MULTIMODAL BENEFITS
SLIDE 76
SUMMARY
SLIDE 77
SUMMARY Addressing the Public Health and Safety crisis is very impactful! Transportation professionals have a vital role in the solutions!
SLIDE 78 CALL TO ACTION
…consider committing to this goal --
design transportation systems:
- for people not cars
- for all users that is safer, eases
congestion, is less costly in the long run, and can spur economic development
- that alleviates challenges of
economic opportunity, energy, security, climate change and health
- promotes clean air
- helps people get more physically active by
providing choices.
SLIDE 79 “In Closing, Vision Zero brings a different approach and mindset that crashes are preventable. 40,000 deaths per year in the US is not acceptable. We have a lot of work to do as we move towards zero and as planners, engineers,
- perators and owners of the transportation system, it is not just a moral, but
an ethical obligation.” We must look to prevent crashes instead of waiting for crashes to happen!
Paula Flores, FITE 2016 ITE International President
SLIDE 80 Presented by:
Paula C. Flores, FITE
- f Greenman-Pedersen, Inc.
pflores@gpinet.com @paula_benway
THANK YOU!