Moving Forward or Falling Back: Planning For Your Fire Departments - - PowerPoint PPT Presentation

moving forward or falling back
SMART_READER_LITE
LIVE PREVIEW

Moving Forward or Falling Back: Planning For Your Fire Departments - - PowerPoint PPT Presentation

Moving Forward or Falling Back: Planning For Your Fire Departments Future Lane Wintermute, Western Regional Director September, 2017 He Who is Failing to Plan, is Planning to Fail - Winston Churchill I would argue that the fire


slide-1
SLIDE 1
slide-2
SLIDE 2

Moving Forward or Falling Back:

Planning For Your Fire Department’s Future

Lane Wintermute, Western Regional Director September, 2017

slide-3
SLIDE 3

“He Who is Failing to Plan, is Planning to Fail”

  • Winston Churchill
slide-4
SLIDE 4

“I would argue that the fire service represents the world’s best crisis managers. No one is better trained, equipped, or skilled to handle hundreds, thousands, or even tens of thousands of unique emergency incidents than America’s fire service. On average… in 26 minutes or less! I would also argue that historically, as a profession, we have done a poor job in the area

  • f planning.”

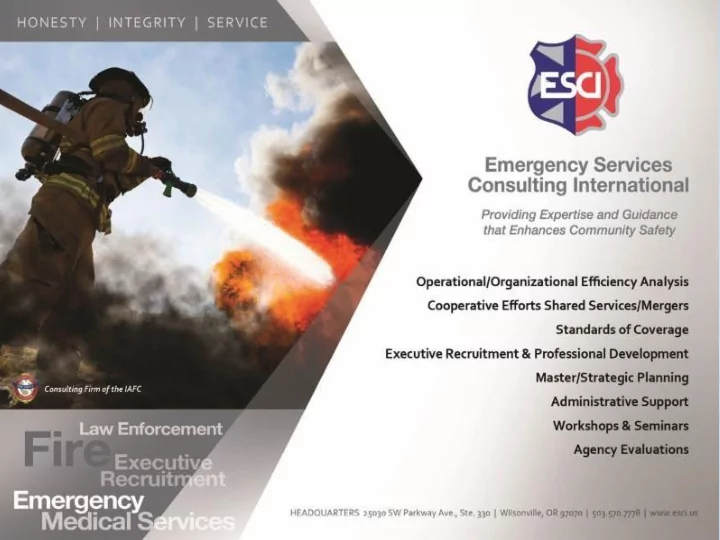
Jack Snook, Founder, ESCI

slide-5
SLIDE 5
  • Tactical/Operational Planning
  • Financial Planning
  • Strategic Planning
  • Master Planning
  • Standards of Cover (Deployment Planning)
  • Special Purpose Planning
  • Cooperative Efforts/Shared Services/District

Formation or Expansion

Emergency Services Planning Levels

slide-6
SLIDE 6

Tactical/Operations Planning

  • Run cards
  • Dispatch Protocols
  • Mutual Aid
  • Automatic Aid
  • Collaborative On Scene Procedures, ICS, SOGs
  • Shared Command Staff Practices
slide-7
SLIDE 7

Financial Planning

  • Annual Budget Process
  • 3 to 5 Year Future Budget Projections
  • Capital Replacement Planning
  • Monitoring/Projecting Revenue

Sources

slide-8
SLIDE 8

Long Range Master Planning

2017

2020 2021

2019

2018

slide-9
SLIDE 9

What is Master Planning?

  • Big Picture
  • High Altitude
  • 10 to 15 Year Planning Window
slide-10
SLIDE 10

Four Questions of Master Planning

  • Where Are We Now?
  • Where Do We Need to Be?
  • How Do We Get There?
  • How Do We Pay For It?
slide-11
SLIDE 11
  • Very resource focused

 Facilities  Apparatus  Staffing

  • Focuses on current service delivery performance and

future service demands

  • Tied to cost projections and revenue planning
  • Linked to community comprehensive planning
  • Historically lacking in the emergency services

Master Planning

slide-12
SLIDE 12
  • Evaluation of Current Conditions

 Where are we now?

  • Projecting Future Service Demands

 Where will we need to be?

  • Development of Response and Resource Future Strategies

 How will we get there?

  • Financial Projections

 How do we pay for it?

Master Planning Components

slide-13
SLIDE 13
  • Agency Evaluation
  • Management components
  • Organizational structure
  • Financial review
  • Staffing and Personnel Mangement
  • Analysis of Current Response Performance
  • Call concurrency
  • Unit hour utilization
  • Outcome measures
  • Capital Asset Review

Evaluation of Current Conditions

slide-14
SLIDE 14
  • Commission on Fire Accreditation International (CPSE)
  • N.F.P.A. Standards

 Health and Safety  Staffing and Deployment  Apparatus and Equipment

  • O.S.H.A. and E.P.A.
  • I.S.O. Criteria
  • EMS Protocols
  • Industry Standards and Best Practices

Where Are We Now? Evaluation of Current Conditions

slide-15
SLIDE 15

Service Demand Analysis

slide-16
SLIDE 16

Resource Distribution Analysis

slide-17
SLIDE 17

Resource Concentration Analysis

slide-18
SLIDE 18

0.5 1 1.5 2 2.5 False alarm Good intent Public assist Hazardous Condition Rescue Motor vehicle accident EMS Overpressure rupture Other fire Wildfire Vehicle fire Building fire All incidents Minutes

City Incident Call Processing Time at 90th Percentile

Response Performance Analysis

0% 10% 20% 30% 40% 50% 60% 70% 80% 90% 100% 20 40 60 80 100 120 140 160 01:00 02:00 03:00 04:00 05:00 06:00 07:00 08:00 09:00 10:00 11:00 12:00 13:00 14:00 15:00 16:00 17:00 18:00 19:00 20:00 21:00 22:00 23:00 24:00 25:00 26:00 27:00 28:00 29:00 30:00 More Count of Incidents Response Minutes Count of Incidents Percentile 2013-2014 Response Time Performance Average 80th Percentile 10:05 15:00

slide-19
SLIDE 19

Responding Station Number of Concurrent Calls By Station Total Reliability Factor 01 02 03 04 05 06 07 08 ST1 1,431 25 26 56 11 1,549 92.38% ST2 46 749 1 16 1 2 815 91.90% ST3 10 513 14 23 21 1 1 583 87.99% ST4 60 1 9 915 29 1 1,015 90.15% ST5 10 13 19 816 2 860 94.88% ST6 9 22 22 1 905 2 10 971 93.20% ST7 11 4 5 2 3 10 216 83 334 64.67% ST8 7 3 2 3 1 36 13 467 539 88.13% Total 1,584 804 590 1,009 872 1,000 235 572 6,666

200 400 600 800 1000 1200 1400 1600 1800 2000 Battalion 1 BRU5 Engine 1 Engine 2 Engine 3 Engine 4 Engine 5 Engine 6 Engine 7 Engine 8 Med Unit 1 Med Unit 2 Med Unit 3 Med Unit 5 Med Unit 6 Med Unit 7 Rescue 4 Truck 1 Truck 2 Truck 3 Utility 1

Response Performance and Reliability

Call Concurrency Unit Hour Utilization

slide-20
SLIDE 20
  • Facilities

 Condition and Viability for Future Use  Suitability and Efficiency  Replacement/Renovation Needs

  • Apparatus

 Condition and Viability for Future Use  Life Expectancy  Establish Replacement Cycle – And Fund It

Capital Assets Assessment

slide-21
SLIDE 21
  • Understanding of Community Comprehensive Plans
  • Expansion/Annexation
  • Population Projections
  • Demographic Analysis and Trends
  • Service Demand Projections
  • Community Risk Analysis

 Present and Future

Where Will We Need To Be? Projecting Future Needs

slide-22
SLIDE 22

Projected Service Demand

2015 2020 2025 2030 2035 2040 EMS 386 476 567 657 748 838 Other 211 261 311 360 410 460 Fires 25 31 37 42 48 54 Overall 622 768 914 1,060 1,206 1,352 200 400 600 800 1,000 1,200 1,400 1,600 200 400 600 800 1,000 1,200 1,400 1,600

slide-23
SLIDE 23

0.000 50.000 100.000 150.000 200.000

Future land use can be used to predict future community risk categorization.

Community Risk Analysis

slide-24
SLIDE 24

Future Community Risk Assessment Type of Need Future Service Demand Frequency of Need Service Level Objectives Risk-Benefit Decisions

How Do We Get There? Resource Deployment Strategies

slide-25
SLIDE 25

First-Due Distribution Initial Response Performance (future road networks) Concentration Of Companies Reliability/Failure (based on future workload) Effective Firefighting Force Critical Tasking (based on future risk)

Resource Deployment Strategies

slide-26
SLIDE 26
  • Capital Outlay Expense Projection
  • Annual Operating Cost Projection
  • Analysis of Optional Strategies

How Do We Pay For It? Financial Projections

slide-27
SLIDE 27

Description Year end 6/30/2008 Actual Year end 6/30/2009 Actual Year end 6/30/2010 Actual Year end 6/30/2011 Actual Year end 6/30/2012 Budget State aid Civil Defense 69,056 73,056 83,743 164,132 128,202 State aid - other 65,872 20,000 Contributions from other cities 16,173 16,794 19,201 17,998 Interest Pooled Money (1,948) (2,378) (169) (131) Contribution from General Fund 121,474 127,444 67,708 50,781 67,708 Other Refunds/Reimbursements 663 17 FEMA Disaster Relief 10,181 10,000 Reimbursement from Services (1,546) 118 71 Charge for Statuary Services Total Revenue 188,582 279,284 188,195 244,252 223,908 Description Year end 6/30/2008 Actual Year end 6/30/2009 Actual Year end 6/30/2010 Actual Year end 6/30/2011 Actual Year end 6/30/2012 Budget Salaries 41.373% 80.223% 50.509% 58.560% 51.429% Benefits 20.257% 34.399% 23.601% 27.632% 22.128% Supplies & Services 14.898%

  • 7.147%

25.889% 13.807% 51.080% Other Charges 0.000% 0.000% 0.000% 0.000% 0.000% Capital Assets 23.472% 0.000% 0.000% 0.000% 12.455% Intra-fund Transfers 0.000%

  • 7.474%

0.000% 0.000%

  • 37.093%

Total Expenditures 100.000% 100.000% 100.000% 100.000% 100.000%

Financial Projections

slide-28
SLIDE 28

Strategic Planning

slide-29
SLIDE 29

“Strategic Planning does not deal with future

  • decisions. It deals with the futurity of present
  • decisions. What we have to do today is to be ready

for an uncertain tomorrow.”

Peter F. Drucker

  • Prof. of Social Science & Mgt.
slide-30
SLIDE 30

The compass needle for an organization… Strategic Planning

slide-31
SLIDE 31

What is Strategic Planning?

  • Gives you a 3 to 5 Year Road Map
  • Establishes (or Updates) Statements Of:
  • Mission
  • Vision
  • Core Values
  • Development of Strategic Initiatives Defined By:
  • Establishment of Goals
  • Measurable Objectives

– Timelines – Responsibility – Critical Tasks

  • Performance Objectives and Targets
  • Measurable Outcomes
  • Facilitated Process
slide-32
SLIDE 32

The most successful strategic planning process involves both internal and external stakeholders, customers and is driven by the central theme of: “What is in the best interest of the citizens served.”

Jack Snook, ESCI Founder

What is Strategic Planning?

slide-33
SLIDE 33
  • Improves Communications
  • Solicits Input
  • Invites Participation
  • Increases Awareness (Internal

and External)

  • Provides Organizational

Growth Opportunities

  • Increases Organizational

Support, Understanding and Appreciation

Positive Effects

slide-34
SLIDE 34
  • Introduction/Philosophy
  • Mission
  • Vision
  • Values or Guiding Principles
  • Identification of Services
  • Prioritization of Services
  • SWOT Analysis
  • Expectations, Concerns and Feedback

Strategic Plan Report Components

slide-35
SLIDE 35

Strategic Plan Report Components

  • Development of Strategic Initiatives
  • Establishment of Goals
  • Measurable Objectives

– Timelines – Responsibility – Critical Tasks

  • Performance Objectives and Targets
  • Measurable Outcomes
slide-36
SLIDE 36
  • Management Team (Fire Chief, Division Leaders)
  • Labor Representatives/Volunteer Representatives
  • Business Owners, Local Industry
  • Chamber of Commerce Representatives
  • Prominent Citizens in the Community
  • Members of Civic Organizations
  • Media Representatives
  • Citizens Who Have Been Recipients of Services
  • Representatives of Neighborhood Organizations

* External Stakeholder meetings are conducted separately from the

internal planning team meetings. Information gathered is utilized and weighted by the internal Planning Team in developing the Strategic Plan.

Stakeholder/Strategic Planning Team Make Up

slide-37
SLIDE 37

“A lot of people don’t realize that the government has customers. We have customers. The American people.”

  • Al Gore

Start With The Customers First

slide-38
SLIDE 38

Where Do We Want to Be?

slide-39
SLIDE 39

Purpose of the Organization

  • Who Are We?
  • Why Do We Exist?
  • What Do We Do?
  • Why Do We Do It?
  • For Whom?

Mission

slide-40
SLIDE 40

“The Anytown Fire Department exists to ensure the health, safety, and well being of our community by providing effective and efficient fire and life safety services.” Sample Mission

slide-41
SLIDE 41
  • What Does the Organization Want?
  • How Does the Organization Wish to be Known by

Others?

  • How Will the Organization Enhance the Quality of

Life for Those Who Use its Services?

  • What is the Ultimate Standard by Which all Progress

is Measured?

*Can be accompanied by Fire Chief or Executive Director

Vision statements that tie into organization vision.

Vision

slide-42
SLIDE 42

Our Vision:

Five years from now, the Anytown Fire Department will be a key team player with local business and citizens, working to maintain a proud family-oriented community with a small-town atmosphere and a strong “sense of place”. Our efficient and effective response will provide an important and valued feeling of security among our citizens, while our continual efforts to prevent such incidents will have a significant and measured effect. We will be fully prepared to mitigate fires, medical emergencies, natural or man-made disasters, and technical rescues, both independently and through an improved network of cooperative regional partners. Our organization will be physically fit, healthy, and an increasingly diverse work force, well trained and empowered with a high level of involvement in our success. Our equipment will be dependable, capable and consistent with the needs of the community, embracing cutting-edge technology, innovation, and emphasizing firefighter safety. The Anytown Fire Department will be a premiere agency providing excellence in public service and, as such, will serve as a model for others seeking success in community satisfaction.

Sample Vision

slide-43
SLIDE 43
  • Express Beliefs About the Conditions Under

Which the Organization Works

  • Express the Organization’s Attitudes About:

– People – Processes – Performance

Values or Guiding Principles

slide-44
SLIDE 44
  • Family and the Importance of the Family Environment
  • Honesty and Integrity
  • Quality and Value
  • Timely, Honest, and Open Communications
  • A Positive “Can-Do” Attitude
  • Respect for Our Customers
  • Teamwork
  • Reputation and Image
  • The Importance of Enjoying Our Work

* This can reside as a department or district Philosophy

document

Example: ESCI’s Guiding Principles

slide-45
SLIDE 45

Our Values: We value honesty in both our leadership and our employees, leading to the highest level of trustworthiness in both spoken and written word. We value and respect diversity as an organization, in our dealings with each

  • ther, and those we serve.

We value teamwork, as we believe that availing ourselves of each person’s talent enhances the services we deliver and that cooperation improves our relationships. We value a commitment to excellence that demonstrates itself through consistent professionalism, pride and a positive attitude. We value knowledge, as it forms the foundation for effective decisions, actions and increased safety. We value respect for each person as an individual, an attitude that recognizes the worth of others and exhibits compassion for those in need.

Sample Values

slide-46
SLIDE 46

Strategic Initiatives

  • Major area organizational focus
  • Future oriented
  • Drives development of objectives

Goals

  • Chart a Clear Direction for the Organization or its

Programs (Purpose)

  • A Desired Result or Outcome

Objectives

  • Specific
  • Measurable
  • Attainable
  • Results-oriented

How Do We Get There?

slide-47
SLIDE 47
  • Service
  • Employee Health, Safety and Welfare
  • Staffing
  • Diversity
  • Finance and Capital
  • Customer Service
  • Training and Professional Development
  • Cooperative Service/Regional Cooperation
  • Other

Typical Initiative Themes

slide-48
SLIDE 48
  • Develop and implement a service delivery model that

is centered on continuous improvement. All services are sustainable and meet a specific need

  • Promote craftsmanship, accountability and a resilient

culture that is united in our common mission

  • Implement and utilize emerging technologies that

support the needs of the organization by:

  • Maximizing operational efficiency
  • Improving quality of service

Goals Define How You Achieve Initiatives

slide-49
SLIDE 49

Objective 1-A Develop a comprehensive set of performance measures and targets for all internal and external services and programs delivered by the Agency. Priority: 1 Timeline: September 2012 – September 2013 Responsibility: Deputy Chief Critical Tasks:

  • Develop a list of all services and programs delivered by the Agency.
  • Define internal/external expectations of the service.
  • Review balance of cost/service levels/methods of service (cost benefit).
  • Develop measurable performance criteria.
  • Develop criteria and procedures to periodically re-evaluate performance against current expectations.
  • Establish a formal feedback mechanism, which informs service providers of service deficiencies,

improvements, and successes.

  • Establish data collection and analysis capability.

Performance Indicators:

  • A Continuous Quality Improvement (CQI) program for each service/program has been developed.
  • Level of service, expressed in measurable terms, are defined for each service/program.
  • A mechanism to measure the outcome has been developed and included with the implementation plan.
  • The outcome measurement is performed and corrective actions to achieve the outcome are

incorporated into the implementation plan. Outcomes: Managers embrace and utilize performance measures and targets to adjust processes and services that are delivered to meet the needs of internal and external customers.

Sample Completed Objective

slide-50
SLIDE 50

Performance Measures

  • Input Measures
  • Output Measures
  • Outcome Measures
  • Efficiency Measures
  • Quality Measures

How Do We Measure Our Progress?

slide-51
SLIDE 51

1. Provide for the arrival of adequate resources to initiate interior fire suppression operations at the scene of any fire within 7 minutes following dispatch, 90% of the time. Current: 9.6 minutes Target: 7 minutes

  • 2. Percentage of citizens surveyed rating the Department’s

performance satisfactory or better shall be 90%. Current: 76% Target: 90%

Sample Performance Measures

slide-52
SLIDE 52
  • Availability
  • Level of Participation in Process
  • Realistic Expectations – Implementation

Differences in Career and Volunteer Process

slide-53
SLIDE 53
  • Adoption of Strategic Plan Implies Support of

Funding

  • Identification of Requirements and Source of

Revenue During Process (Discussion)

  • Qualification of Objective (Pending Funding)

Strategic Planning and the Budget Process

slide-54
SLIDE 54

Sample Timeline

slide-55
SLIDE 55
  • Flawed Process
  • Failure to Adopt or Fund
  • Over Ambitious
  • Failure to Incorporate into Processes

– Budget – Staff Meetings – Board/Council Updates – Performance Reviews

  • Domination by Person(s)
  • Failure to Issue ‘Duct Tape’

Reasons for Failure

slide-56
SLIDE 56
  • Understanding of Purpose and Process
  • Participation and Involvement
  • Comprehensive Analysis of Where You Are
  • Facilitation
  • Realistic Expectations
  • Achievable (Timelines, Activities)
  • Early success is important

Keys to Success

slide-57
SLIDE 57

Standards of Cover – Deployment Planning

slide-58
SLIDE 58

What is a Standard of Cover?

  • Detailed Deployment Analysis
  • Similar to a Master Plan but Focusing Only On

Deployment

  • Analyzes Current Deployment In Area Of:
  • Service Demand by Type and Location
  • Resource Concentration
  • Resource Distribution
  • Response Performance
  • Response Reliability
  • Very Highly Data Driven and Data Dependent
slide-59
SLIDE 59

What is a Standard of Cover?

  • Based On Criteria Established by The

Commission on Fire Accreditation International (CFAI)

  • Required for Accreditation, Along With a

Strategic Plan

slide-60
SLIDE 60

Why a Standard of Cover?

  • To Quantify Your Current Service

Delivery

  • Provide Data and Tools For Future

Deployment Planning

  • Required for Accreditation
slide-61
SLIDE 61

Elements Of An SOC

  • Description of Community Served
  • Review of Services Provided
  • Capital Facilities and Apparatus Review
  • Review of Community & Agency

Expectations and Performance Goals

  • Community Risk Assessment
slide-62
SLIDE 62

Elements Of An SOC

  • Review of Historical System Performance
  • Performance Objectives and Measures
  • Overview of Compliance Methodology
  • Overall Evaluation, Conclusions, and

Recommendations to Policy Makers

slide-63
SLIDE 63

Do I Need an SOC, Strategic Plan, Master Plan?

  • The Master Plan is Big Picture, Long

Range (10 to 15 Years)

  • The Strategic Plan is Shorter Term (3 to 5

Years) Focused on Goals and Objectives, Creating a Road Map

  • The SOC is More Comprehensive In Terms
  • f Service Delivery and Risk Analysis, But

Focused Only On Deployment

slide-64
SLIDE 64

Making the Pieces Fit Through Cooperative Efforts, Merger, Consolidation, District Formation or Expansion

slide-65
SLIDE 65

The Million Dollar Question: What is in the best interest

  • f the community we serve?

Cooperative Service Provision

slide-66
SLIDE 66
  • It would provide a comprehensive look at

what you have:

 Programs  Services  Strengths and deficiencies  Opportunities and threats

  • Looking at “options” is good government
  • Creates basis for future planning
  • Provides basis for sound decision making

Why Consider Cooperative Services?

slide-67
SLIDE 67
  • Potential reduction in costs
  • Future Cost Avoidance
  • Economies of scale
  • Increased services/levels
  • Shift in ISO rating
  • Reduces risk or liability
  • Enhances bench strength (people)
  • Elimination of duplication

Why Consider Cooperative Services?

slide-68
SLIDE 68
  • Stations
  • Apparatus
  • Equipment
  • Personnel
  • Utility costs
  • Maintenance
  • Insurance

Duplication in….

slide-69
SLIDE 69
  • Depth of service
  • Allows sharing of staff and personnel
  • Standardization of services
  • Standardization of programs
  • Recruitment
  • Public education, etc.
  • Political clout
  • Ability to absorb financial crisis

Added Benefits

slide-70
SLIDE 70
  • Governance Model
  • Services and Programs Review
  • Financial and Operational Evaluation
  • Administration and Human Resources
  • Organizational Structure
  • Facilities, Apparatus, Equipment
  • Policies, Agreements, Contracts

Analysis is Critical…

slide-71
SLIDE 71

CALCULATED FINANCIAL COMPARISON EAST CLACKAMAS COUNTY CONCEPTUAL MODELS Expenses Concept 1 Concept 2 Concept 3 Concept 4 BFD-EFD BFD-SFD EFD-SFD ALL Personal Services $2,695,608 $2,991,697 $2,349,995 $4,161,817 Materials & Svc $1,112,494 $1,215,993 $943,751 $1,644,340 Capital Outlay $183,070 $147,120 $46,050 $188,120 Reserve $268,867 $182,867 $86,000 $268,867 Contingency $225,000 $255,000 $120,000 $300,000 Total Modeled Exp. $4,485,038 $4,792,677 $3,545,796 $6,563,144 Revenues Total Non-Tax Rev. $555,192 $446,732 $340,414 $671,169

  • Calc. Tax Rate

Assessed Value $1,654,609,975 $1,927,353,203 $1,374,884,346 $2,478,423,762 Modeled Expense $4,485,038 $4,792,677 $3,545,796 $6,563,144 Non-Tax Revenue $555,192 $446,732 $340,414 $671,169

  • Calc. Tax Levy

$3,929,846 $4,345,95 $3,205,382 $5,891,975

  • Calc. Tax Rate

$2.3751 $2.2549 $2.3314 $2.3773

Financial Comparisons

slide-72
SLIDE 72

CALCULATED FINANCIAL COMPARISON EAST CLACKAMAS COUNTY CONCEPTUAL MODELS Expenses Concept 1 Concept 2 Concept 3 Concept 4 BFD-EFD BFD-SFD EFD-SFD ALL Personal Services $2,695,608 $2,991,697 $2,349,995 $4,161,817 Materials & Svc $1,112,494 $1,215,993 $943,751 $1,644,340 Capital Outlay $183,070 $147,120 $46,050 $188,120 Reserve $268,867 $182,867 $86,000 $268,867 Contingency $225,000 $255,000 $120,000 $300,000 Total Modeled Exp. $4,485,038 $4,792,677 $3,545,796 $6,563,144 Revenues Total Non-Tax Rev. $555,192 $446,732 $340,414 $671,169

  • Calc. Tax Rate

Assessed Value $1,654,609,975 $1,927,353,203 $1,374,884,346 $2,478,423,762 Modeled Expense $4,485,038 $4,792,677 $3,545,796 $6,563,144 Non-Tax Revenue $555,192 $446,732 $340,414 $671,169

  • Calc. Tax Levy

$3,929,846 $4,345,95 $3,205,382 $5,891,975

  • Calc. Tax Rate

$2.3751 $2.2549 $2.3314 $2.3773

Revenue Comparisons

slide-73
SLIDE 73

Combined Service Area Coverage

slide-74
SLIDE 74
  • Turf
  • Power
  • Politics
  • Control
  • Money
  • Timing

Beware of the BIG Six…

slide-75
SLIDE 75
  • Cooperative Efforts Feasibility Studies
  • Master Planning
  • Strategic Planning
  • Standards of Cover Reports
  • Executive Recruitment/Professional Career

Development

  • Entry Level and Promotional Testing
  • ISO Benchmarking Comparisons

ESCI Services Overview

slide-76
SLIDE 76

Lane Wintermute, Western Regional Director lane.wintermute@esci.us 1-800-757-3724| www.esci.us ESCI’s booth is located in the vendor area

Thank You!