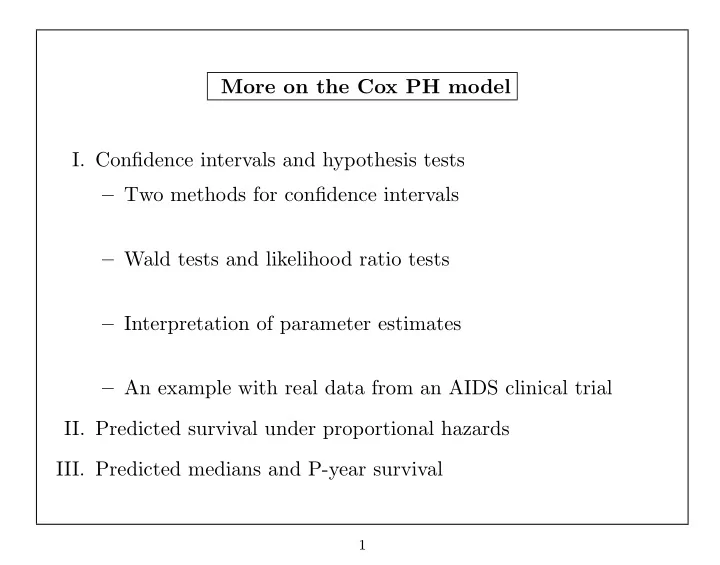
SLIDE 1 More on the Cox PH model
- I. Confidence intervals and hypothesis tests
– Two methods for confidence intervals – Wald tests and likelihood ratio tests – Interpretation of parameter estimates – An example with real data from an AIDS clinical trial
- II. Predicted survival under proportional hazards
- III. Predicted medians and P-year survival
1
SLIDE 2
- I. Constructing Confidence intervals and tests for the Hazard Ratio
(see Collett 3.4): Many software packages provide estimates of β, but the hazard ratio (i.e., exp(β)) is usually the parameter of interest. We can use the delta method to get standard errors for exp(ˆ β): V ar(exp(ˆ β)) = exp(2ˆ β)V ar(ˆ β)
2
SLIDE 3 Constructing confidence intervals for exp(β) Two options: (assuming that β is a scalar)
β) obtained above via the delta method as se(exp ˆ β) =
β))], calculate the endpoints as: [L, U] = [e
ˆ β − 1.96 se(e ˆ β), e ˆ β + 1.96 se(e ˆ β)]
- II. Form a confidence interval for ˆ
β, and then exponentiate the endpoints. [L, U] = [e
ˆ β−1.96se( ˆ β), e ˆ β+1.96se( ˆ β)]
Method II is preferable since ˆ β converges to a normal distribution more quickly than exp(ˆ β).
3
SLIDE 4 Hypothesis Tests: For each covariate of interest, the null hypothesis is Ho : βj = 0 A Wald testa of the above hypothesis is constructed as: Z = ˆ βj se( ˆ βj)
χ2 =
βj se( ˆ βj) 2 The test for βj = 0 assumes that all other terms in the model are fixed. If we have a factor A with a levels, then we would need to construct a χ2 test with (a − 1) df, using a test statistic based on a quadratic form: χ2
(a−1)
=
′ AV ar(
βA)−1 βA where βA = (β2, ..., βa)′ are the (a − 1) coefficients corresponding to Z2, ..., Za (or Z1, ..., Za−1, depending on the reference group).
aThe first follows a normal distribution, and the second follows a χ2 with 1 df.
STATA gives the Z statistic, while SAS gives the χ2
1 test statistic (the p-values are
also given, and don’t depend on which form, Z or χ2, is provided) 4
SLIDE 5 Comparing nested models ⇒ Likelihood Ratio Tests: Suppose there are (p + q) explanatory variables measured: Z1, . . . , Zp, Zp+1, . . . , Zp+q and proportional hazards are assumed. Consider the following models:
- Model 1: (contains only the first p covariates)
λi(t, Z) λ0(t) = exp(β1Z1 + · · · + βpZp)
- Model 2: (contains all (p + q) covariates)
λi(t, Z) λ0(t) = exp(β1Z1 + · · · + βp+qZp+q)
5
SLIDE 6 These are nested models. For such nested models, we can construct a likelihood ratio test of H0 : βp+1 = · · · = βp+q = 0 as: χ2
LR
= −2
L(1)) − log(ˆ L(2))
- Under Ho, this test statistic is approximately distributed as χ2
with q df.
6
SLIDE 7 Some examples using the Stata stcox command: Model 1:
. use mac . stset mactime macstat . stcox karnof rif clari, nohr failure _d: macstat analysis time _t: mactime Cox regression -- Breslow method for ties
1151 Number of obs = 1151
121 Time at risk = 489509 LR chi2(3) = 32.01 Log likelihood =
Prob > chi2 = 0.0000
_d | Coef.
z P>|z| [95% Conf. Interval]
- --------+-------------------------------------------------------------
karnof |
.0106355
0.000
rif | .8723819 .2369497 3.682 0.000 .4079691 1.336795 clari | .2760775 .2580215 1.070 0.285
.7817903
SLIDE 8 Model 2:
. stcox karnof rif clari cd4, nohr failure _d: macstat analysis time _t: mactime Cox regression -- Breslow method for ties
1151 Number of obs = 1151
121 Time at risk = 489509 LR chi2(4) = 63.74 Log likelihood =
Prob > chi2 = 0.0000
_d | Coef.
z P>|z| [95% Conf. Interval]
- --------+---------------------------------------------------------------
karnof |
.0106652
0.001
rif | .880338 .2371111 3.713 0.000 .4156089 1.345067 clari | .2530205 .2583478 0.979 0.327
.7593729 cd4 |
.0036839
0.000
SLIDE 9 Notes:
- If we omit the nohr option, we will get the estimated hazard ratio
along with 95% confidence intervals using Method II (i.e., forming a CI for the log HR (beta), and then exponentiating the bounds)
_d | Haz. Ratio
z P>|z| [95% Conf. Interval]
- --------+--------------------------------------------------------------
karnof | .9638171 .0102793
0.001 .9438791 .9841762 rif | 2.411715 .5718442 3.713 0.000 1.515293 3.838444 clari | 1.28791 .3327287 0.979 0.327 .7762102 2.136936 cd4 | .9818121 .0036169
0.000 .9747486 .9889269
- We can also compute the hazard ratio ourselves, by exponentiating
the coefficients: HRcd4 = exp(−0.01835) = 0.98 Why is this HR so close to 1, and yet still significant? What is the interpretation of this HR?
9
SLIDE 10
- In the mac study, there were three treatment arms (rif, clari, and
the rif+clari combination). Because we have only included the rif and clari effects in the model, the combination therapy is the “reference” group.
- We can conduct an overall test of treatment using the test
command in Stata:
. test rif clari ( 1) rif = 0.0 ( 2) clari = 0.0 chi2( 2) = 17.01 Prob > chi2 = 0.0002
for a 2 df Wald chi-square test of whether both treatment coefficients are equal to 0. This test command can be used to conduct an overall test for any number of effects.
10
SLIDE 11
- The test command can also be used to test whether there is a
difference between the rif and clari treatment arms:
. test rif=clari ( 1) rif - clari = 0.0 chi2( 1) = 8.76 Prob > chi2 = 0.0031
- The likelihood ratio test for the effect of CD4 is twice the difference
in minus log-likelihoods between the two models: χ2
LR
= 2 ∗ (754.53 − (738.66)) = 31.74 How does this test statistic compare to the Wald χ2 test?
11
SLIDE 12
- II. Predicted Survival using PH
The Cox PH model says that λi(t, Z) = λ0(t) exp(βZ). What does this imply about the survival function, Sz(t), for the i-th individual with covariates Zi? For the baseline (reference) group, we have: S0(t) = e−
t
0 λ0(u)du = e−Λ0(t)
This is by definition of a survival function (see intro notes).
12
SLIDE 13 For the i-th patient with covariates Zi, we have: Si(t) = e−
t
0 λi(u)du = e−Λi(t)
= e−
t
0 λ0(u) exp(βZi)du
= e− exp(βZi)
t
0 λ0(u)du
=
t
0 λ0(u)duexp(βZi)
= [S0(t)]exp(βZi) (This uses the mathematical relationship [eb]a = eab)
13
SLIDE 14 Say we are interested in the survival pattern for single males in the nursing home study. Based on the previous formula, if we had an estimate for the survival function in the reference group, i.e., ˆ S0(t), we could get estimates of the survival function for any set of covariates Zi. How can we estimate the survival function, S0(t)? We could use the KM estimator, but there are a few disadvantages of that approach:
- It would only use the survival times for observations contained in
the reference group, and not all the rest of the survival times.
- It would tend to be somewhat choppy, since it would reflect the
smaller sample size of the reference group.
- It’s possible that there are no subjects in the dataset who are in the
“reference” group (ex. say covariates are age and sex; there is no
- ne of age=0 in our dataset).
14
SLIDE 15 Instead, we will use a baseline hazard estimator which takes advantage of the proportional hazards assumption to get a smoother estimate. ˆ Si(t) = [ ˆ S0(t)]exp( βZi) Using the above formula, we substitute β based on fitting the Cox PH model, and calculate ˆ S0(t) by one of the following approaches:
- Breslow estimator (Stata)
- Kalbfleisch/Prentice estimator (SAS)
15
SLIDE 16 (1) Breslow Estimator: ˆ S0(t) = exp−ˆ
Λ0(t)
where ˆ Λ0(t) is the estimated cumulative baseline hazard: ˆ Λ(t) =
- j:τj<t
- dj
- k∈R(τj) exp(β1Z1k + . . . βpZpk)
- (2) Kalbfleisch/Prentice Estimator
ˆ S0(t) =
ˆ αj where ˆ αj, j = 1, ...d are the MLE’s obtained by assuming that S(t; Z) satisfies S(t; Z) = [S0(t)]eβZ =
j:τj<t
αj
eβZ
=
αeβZ
j 16
SLIDE 17 Breslow Estimator: further motivation The Breslow estimator is based on extending the concept of the Nelson-Aalen estimator to the proportional hazards model. Recall that for a single sample with no covariates, the Nelson-Aalen Estimator of the cumulative hazard is: ˆ Λ(t) =
dj rj where dj and rj are the number of deaths and the number at risk, respectively, at the j-th death time.
17
SLIDE 18 When there are covariates and assuming the PH model above, one can generalize this to estimate the cumulative baseline hazard by adjusting the denominator: ˆ Λ(t) =
- j:τj<t
- dj
- k∈R(τj) exp(β1Z1k + . . . βpZpk)
- Heuristic: The expected number of failures in (t, t + δt) is
dj ≈ δt ×
λ0(t)exp(zk ˆ β) Hence, δt × λ0(tj) ≈ dj
β)
18
SLIDE 19 Kalbfleisch/Prentice Estimator: further motivation This method is analogous to the Kaplan-Meier Estimator. Consider a discrete time model with hazard (1 − αj) at the j-th observed death time. ( Note: we use αj = (1 − λj) to simplify the algebra!) Thus, for someone with z=0, the survivorship function is S0(t) =
αj and for someone with Z = 0, it is: S(t; Z) = S0(t)eβZ =
j:τj<t
αj
eβZ
=
αeβZ
j 19
SLIDE 20 The likelihood contributions under this model are:
- for someone censored at t:
S(t; Z)
- for someone who fails at tj:
S(t(j−1); Z) − S(tj; Z) =
k<j
αj
eβz
[1 − αeβZ
j
] The solution for αj satisfies:
exp(Zkβ) 1 − αexp(Zkβ)
j
=
exp(Zkβ) (Note what happens when Z = 0)
20
SLIDE 21 Obtaining ˆ S0(t) from software packages
- Stata provides the Breslow estimator of S0(t; Z), but not
predicted survivals at specified covariate values..... you have to construct these yourself
- SAS uses the Kalbfleisch/Prentice estimator of the baseline
hazard, and can provide estimates of survival at arbitrary values of the covariates with a little bit of programming. In practice, they are incredibly close! (see Fleming and Harrington 1984, Communications in Statistics)
21
SLIDE 22
Using Stata to Predict Survival The Stata command basesurv calculates the predicted survival values for the reference group, i.e., those subjects with all covariates=0. (1) Baseline Survival: To obtain the estimated baseline survival ˆ S0(t), follow the example below (for the nursing home data):
. use nurshome . stset los fail . stcox married health, basesurv(prsurv) . sort los . list los prsurv 22
SLIDE 23 Estimating the Baseline Survival with Stata
los prsurv 1. 1 .99252899 2. 1 .99252899 3. 1 .99252899 4. 1 .99252899 5. 1 .99252899 . . . 37. 2 .98671824 38. 2 .98671824 39. 2 .98671824 40. 3 .98362595 41. 3 .98362595 . . .
Stata creates a predicted baseline survival estimate for every
- bserved event time in the dataset, even if there are duplicates.
23
SLIDE 24
(2) Predicted Survival for Subgroups To obtain the estimated survival ˆ Si(t) for any other subgroup (i.e., not the reference or baseline group), follow the Stata commands below:
. predict betaz, xb . gen newterm=exp(betaz) . gen predsurv=prsurv^newterm . sort married health los . list married health los predsurv 24
SLIDE 25
Predicting Survival for Subgroups with Stata
married health los predsurv 1. 2 1 .9896138 8. 2 2 .981557 11. 2 3 .9772769 ................................................................ 300. 3 1 .9877566 302. 3 2 .9782748 304. 3 3 .9732435 ................................................................ 768. 4 1 .9855696 777. 4 2 .9744162 779. 4 3 .9685058 . . 1468. 1 4 1 .9806339 1469. 1 4 2 .9657326 1472. 1 4 3 .9578599 ................................................................ 1559. 1 5 1 .9771894 1560. 1 5 2 .9596928 1562. 1 5 3 .9504684 25
SLIDE 26
- III. Predicted medians and P-year survival
Predicted Medians Suppose we want to find the predicted median survival for an individual with a specified combination of covariates (e.g., a single male with health status 0). Three possible approaches: (1) Calculate the median from the subset of individuals with the specified covariate combination (using KM approach) (2) Generate predicted survival curves for each combination of covariates, and obtain the medians directly
OBS MARRIED HEALTH LOS PREDSURV 171 2 184 0.50104 172 2 185 0.49984 474 5 78 0.50268 475 5 80 0.49991 26
SLIDE 27
897 1 2 108 0.50114 898 1 2 109 0.49986 1233 1 5 47 0.50519 1234 1 5 48 0.49875
Recall that previously we defined the median as the smallest value of t for which ˆ S(t) ≤ 0.5, so the medians from above would be 185, 80, 109, and 48 days for single healthy, single unhealthy, married healthy, and married unhealthy, respectively.
27
SLIDE 28
(3) Generate the predicted survival curve from the estimated baseline hazard, as follows: We want the estimated median (M) for an individual with covariates Zi. We know S(M; Z) = [S0(M)]eβZi = 0.5 Hence, M satisfies (multiplying both sides by e−βZi): S0(M) = [0.5]e−βZi
28
SLIDE 29
Example: Suppose we want to estimate the median survival for a single unhealthy subject from the nursing home data. The reciprocal of the hazard ratio for unhealthy (health=5) is: e−0.165∗5 = 0.4373, (where ˆ β = 0.165 for health status) So, we want M such that S0(M) = (0.5)0.4373 = 0.7385 From the estimated baseline survival curve (this is tricky!... we might be tempted to look at the survival estimates for single unhealthy, but we actually need to look at those for single, health=0):
OBS MARRIED HEALTH LOS PREDSURV 79 78 0.74028 80 80 0.73849 81 81 0.73670
So the estimated median would still be 80 days. Note: similar logic can be followed to estimate other quantiles besides the median.
29
SLIDE 30 Estimating P-year survival Suppose we want to find the P-year survival rate for an individual with a specified combination of covariates, ˆ S(P; Zi) For an individual with Zi = 0, the P-year survival can be obtained from the baseline survivorship function, ˆ S0(P) For individuals with Zi = 0, it can be obtained as: ˆ S(P; Zi) = [ ˆ S0(P)]e
30
SLIDE 31 Notes:
- Although I say “P-year” survival, the units of time in a
particular dataset may be days, weeks, or months. The answer here will be in the same units of time as the original data.
βZi is positive, then the P-year survival rate for the i-th individual will be lower than for a baseline individual. Why is this true?
31