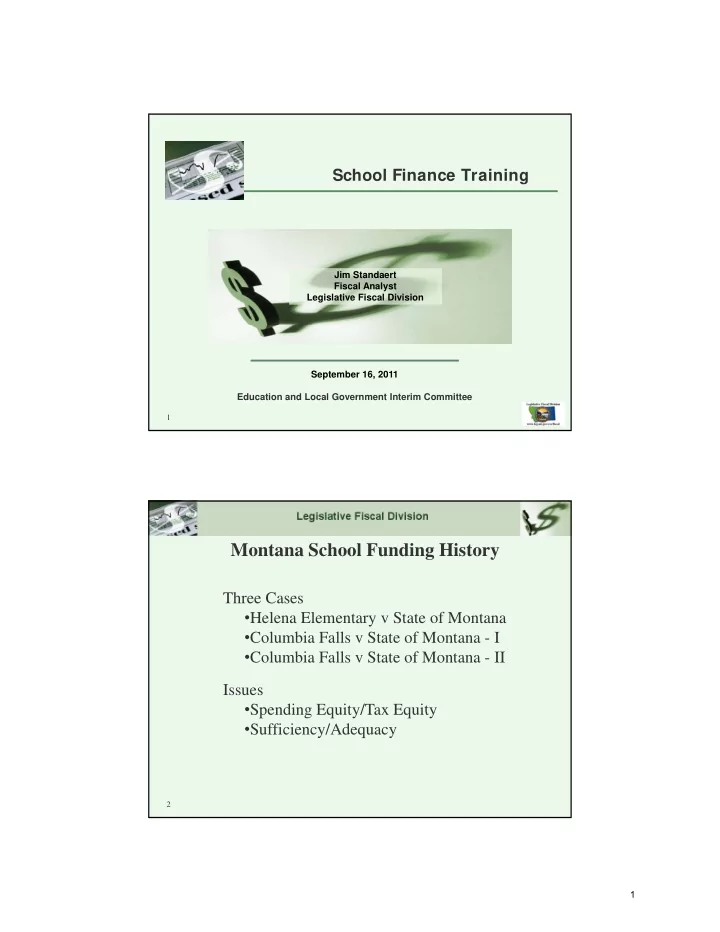
montana school funding history
play

Montana School Funding History Three Cases Helena Elementary v - PDF document

School Finance Training Jim Standaert Fiscal Analyst Legislative Fiscal Division September 16, 2011 Education and Local Government Interim Committee 1 Montana School Funding History Three Cases Helena Elementary v State of Montana


  1. School Finance Training Jim Standaert Fiscal Analyst Legislative Fiscal Division September 16, 2011 Education and Local Government Interim Committee 1 Montana School Funding History Three Cases • Helena Elementary v State of Montana • Columbia Falls v State of Montana - I • Columbia Falls v State of Montana - II Issues • Spending Equity/Tax Equity Spending Equity/Tax Equity • Sufficiency/Adequacy 2 1

  2. Montana K ‐ 12 Foundation Schedules, Permissive Amount, Voted Levies in the District General Fund ‐ 1950 ‐ 1991 $600,000,000 250,000 V t d L Voted Levy $500,000,000 Permissive Budget Without Vote 200,000 Public School Foundation Program Inflation $400,000,000 $400 000 000 ANB (P ANB (Pupils) il ) 150,000 A $300,000,000 N B 100,000 $200,000,000 50,000 50,000 $100,000,000 $0 ‐ 1950 1952 1954 1956 1958 1960 1962 1964 1966 1968 1970 1972 1974 1976 1978 1980 1982 1984 1986 1988 1990 1950 1952 1954 1956 1958 1960 1962 1964 1966 1968 1970 1972 1974 1976 1978 1980 1982 1984 1986 1988 1990 Fiscal Year 3 2

  3. Helena Elementary v State of Montana "It is not possible to examine and understand the relationship between any two of these variables without considering the third variable as well. That is, any attempt to discern the relationship between district wealth and spending per pupil, without also considering district tax effort, is overly simplistic and ill- conceived. Helena Elem v State: Pg 56 - 133 i d H l El St t P 56 133 • Spending per pupil • District tax wealth • Tax Effort 4 Differences in Spending per Pupil are the result of differences in: • Size • Level: elementary vs middle school vs high school • Pupil needs: special education, gifted and talented • Tax Wealth • Nonlevy Revenue (although oil and gas revenue was part of property tax base – net proceeds) t f t t b t d ) • Tax effort • Community preferences 5 3

  4. Spending Per Pupil • District general fund spending less state special education spending excluding impact aid districts Exclude spending associated with educationally relevant factors • Compare spending of top spending district (excluding districts with 5% of students) to spending of lowest spending district (excluding districts with 5% of students) – for each size category t d t ) f h i t • Federal Range Ratio Test – Criteria: 95 th percentile district should spend no more than 125% of the 5 th percentile district 6 Structure of FY 1989 School Funding Schedule Amounts Elementary ANB # Teachers Fixed Per ANB Decrement < 9 NA $ 20,158 $ - $ - 10 - 17 NA $ 20,158 $ 842.50 $ - 14 - 17 Instr Aide $ 33,042 $ 842.50 $ - 18 - 25 one $ 27,741 $ 842.50 $ - 18 - 50 two $ 44,290 $ 527.60 $ - 41 - 100 three $ - $ 1,957.00 $ 1.90 101 - 300 NA $ - $ 1,843.00 $ 1.74 300 + NA $ $ - $ $ 1,496.00 , $ $ - 7 4

  5. Structure of FY 1989 School Funding Schedule Amount High School ANB # Teachers Fixed Per ANB Decrement < 24 24 NA A $ $ 114 84 114,845 $ $ - $ $ - 25 - 40 NA $ - $ 4,785.00 $ 26.10 41 - 100 NA $ - $ 4,368.00 $ 26.10 101 - 200 NA $ - $ 2,802.00 $ 4.37 201 - 300 NA $ - $ 2,365.00 $ 2.40 301 -600 NA $ - $ 2,125.00 $ 0.44 600 + NA $ - $ 1,993.00 $ - 8 Structure of FY 1989 School Funding (Cont.) • State and County pays for Schedules (45 mills + other state) • Maximum general fund budget without a vote = 104% of last year’s budget, or 125% of foundation schedules • Special Ed – State allowable costs times number of Special Ed ANB • Can vote any amount above MGFBWV • Retirement totally funded by taxes at county level • Capital outlay totally funded by taxes at district level 9 5

  6. SOU URCES OF REVENU UE FOR SCHO OOL DISTRICT GE NERAL FUND BUD GET SUPPORT - FY Y 1989 Total 6 $48 80,612,000 $3 3,219/ANB TOTAL GENE ERAL FUND BUDGET $17 76,604,000 $1 1,183/ANB 37% DI ISTRICT District Vot ted Levy (property y tax approved by distri ict voters -- about 1 /3 of the total budget). MAXIMUM GE ENERAL FUND BUDGET WIT THOUT A VOTE (PERMISSIVE E BUDGET)* State Perm missive Share STATE S (surplus e equalization & legislati ve $6 60,791,000 appropria ation) $ $407/ANB 13% District Per rmissive Levy 6 mills ma aximum - elementary DI ISTRICT 4 mills ma aximum - high school (property y tax approved by scho ool board) FOUNDATION N PROGRAM (80% of the M Maximum Permissive B Budget) Deficiency - Supplemental legisla ative STATE S appropria ation if needed State Equa alization Aid S STATE (earmarke ed revenue, legislative appro- $24 43,217,000 priation, interest and income, a nd sur- $1 1,629/ANB plus from m counties) 51% County Eq ualization Aid Mandator ry Basic County Levy 28 mills - elementary COUNTY C 17 mills - high school Taylor gra azing fees Miscellan neous county collection ns County c ash reappropriated (surplus d deposited instate equa alization aid accou unt) *NOTE: "Ma aximum Permissive Bu dget" is determined b by multiplying the per-p pupil rate set forth in thelaw times the scho ool's 10 ANB and ad dding to this figure the e approved allowable c costs for special educ cation.

  7. 1985-86 spending per pupil disparity ratios, by size category, 95 th percentile divided by 5 th percentile Elementary <= 9 3.59 10 - 17 3.12 18 - 40 18 - 40 2 30 2.30 41 - 100 2.72 101 - 300 2.35 300 + 1.65 High School <= 24 1.97 25 - 40 2.39 41 - 100 2.39 101 - 200 2.11 201 - 300 2.35 301 -600 2.07 600 + 1.22 11 1989 Taxable Value per Pupil 95 th percentile divided by 5th Elementary Elementary Spend/Pupil Spend/Pupil TV per Pupil TV per Pupil <= 9 3.59 24.21 10 - 17 3.12 16.47 18 - 40 2.30 13.69 41 - 100 2.72 8.70 101 - 300 2.35 59.64 300 + 300 + 1 65 1.65 2 53 2.53 12 7

  8. 1989 Taxable Value per Pupil 95 th percentile divided by 5th High School Spend/Pupil TV per Pupil <= 24 1.97 3.26 25 - 40 2.39 4.44 41 - 100 2.39 6.54 101 - 200 2.11 7.38 201 - 300 2.35 4.25 301 -600 2.07 24.96 600 + 1.22 1.64 13 Same Size – Unequal spending – Same tax effort – Unequal wealth Size Size Spending/ANB Spending/ANB District Mills District Mills Wealth - TV/ANB Wealth TV/ANB Belfry Elem 118 $ 4,548 27.90 $ 97,642 Ramsay Elem 113 $ 2,938 27.90 $ 40,691 Sidney HS 506 $ 3,301 10.80 $ 124,713 Hamilton HS 506 $ 2,219 12.00 $ 15,914 14 8

  9. Same Size – Unequal spending – Unequal tax effort – Unequal wealth Size Size Spending/ANB Spending/ANB District Mills District Mills Wealth - TV/ANB Wealth - TV/ANB Noxon Elem 133 $800 more 33.55 $ 38,084 Fort Shaw Simms El 133 60.00 $ 8,121 Whitewater El 63 $ 5,119 12.36 $ 209,794 Ulm Elem 66 $ 2,845 78.62 $ 10,565 Choteau HS 157 $ 4,358 21.60 $ 73,889 Fairfield HS 137 $ $ 3,657 44.36 $ $ 21,848 15 Same Size – Same spending – Unequal tax effort – Unequal wealth Size Size Spending/ANB Spending/ANB District Mills District Mills Wealth - TV/ANB Wealth TV/ANB Twin Bridges 150 $ 2,688 99.17 $ 8,207 Alberton El 161 $ 2,786 33.87 $ 29,558 Sidney HS 506 roughly the 10.80 $ 124,713 Fergus HS 488 same 42.26 $ 22,532 16 9

  10. Deficiencies in Opportunities Between Districts • Many schools have no science labs and insufficient supplies pp • Many schools have outdated typewriters, dictation devices, and computers, and insufficient storage when they do have these things • Many schools have inadequate libraries and outdated materials like encyclopedias • Many districts have old textbooks or inadequate numbers of textbooks • Many districts have shortages of basic supplies, art supplies, etc. 17 Deficiencies in Opportunities Between Districts (Continued) • Many districts cannot afford gifted and talented di i ff d if d d l d programs • None of the plaintiff districts were able to provide in – service training • Many plaintiff districts have no extracurricular programs programs • Many districts have serious difficulties with their facilities and maintenance is deferred 18 10

  11. District Court (upheld by Supreme Court) Found the following in the Helena v State of Montana Case • Highl • Highly unequal general fund spending per ANB neq al general f nd spending per ANB • Unequal spending per ANB means unequal educational opportunities across districts • Unequal spending is the result of too much reliance on local property taxes • Retirement spending is too dependent on local property Retirement spending is too dependent on local property taxes and also inequitable • Capital outlay is too dependent on local property taxes and also inequitable 19 Legislature responded by passing HB 28 in special session in Summer 1989 • New law effective for FY 1991 • Increased state share by raising Schedules, minimum of 17% • Substantially increased state share by having State and County pay 100% of schedules • Widened Permissive Amount = 35% of schedules • State creates GTB payments to help districts pay for Permissive amount, based on lack of wealth • Removed coal, oil and gas from the property tax base – created local government severance taxes, and gross proceeds tax – liability neutral • Increased county equalization levies from 45 mills to 55 mills • Created a new Statewide property tax levy – 40 mills • Total statewide mills increased from 45 to 95 mills 20 11

Download Presentation
Download Policy: The content available on the website is offered to you 'AS IS' for your personal information and use only. It cannot be commercialized, licensed, or distributed on other websites without prior consent from the author. To download a presentation, simply click this link. If you encounter any difficulties during the download process, it's possible that the publisher has removed the file from their server.

Recommend


More recommend