
SLIDE 1
FOSS4G 2015 16 Sep 2015
Hiroaki Sengoku, Ph.D Satoshi Ueyama
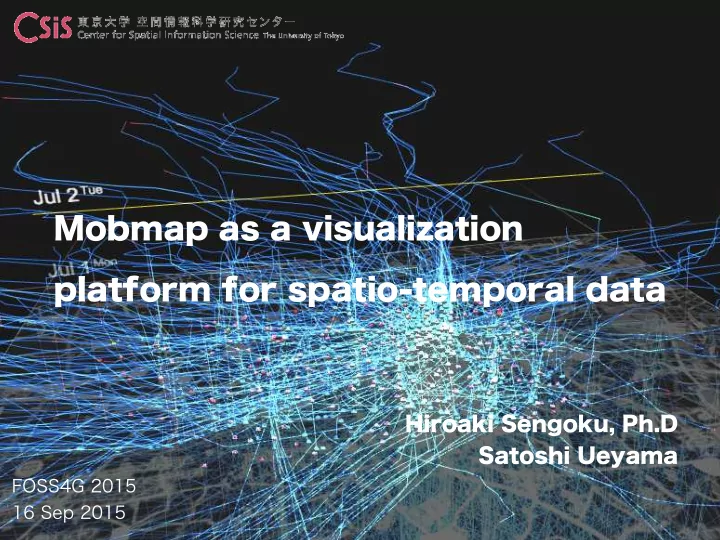
Mobmap as a visualization platform for spatio-temporal data
Mobmap as a visualization platform for spatio-temporal data About - - PowerPoint PPT Presentation
FOSS4G 2015 16 Sep 2015 Hiroaki Sengoku, Ph.D Satoshi Ueyama Mobmap as a visualization platform for spatio-temporal data About microbase inc. microbase Inc. is the company which creates micro demographic data in Japan. This company has
FOSS4G 2015 16 Sep 2015
Hiroaki Sengoku, Ph.D Satoshi Ueyama
Mobmap as a visualization platform for spatio-temporal data
microbase Inc. is the company which creates micro demographic data in Japan. This company has created simulated urban data such as people flow or people life style using
the world and simulation platform such as “Sim City” using these data.
Real-estate values Building Age
Future Population Micro Census Personal LifeStyle
三겹살、삼겹살、맛있다~!!
Hiro Ritsu Satoshi
SESSION 1 INTRODUCTION ・Mobmap ・Hands-on data SESSION 2 ANALYSIS ・Basic operation ・Attribute query ・Spatial query ・Other functions SESSION 3 PRACTICE ・Practice ・Summary
1500,1,1,1998/10/01 06:00:00,139.9249985549,35.7318406842,2,7,4110309,14,97,33,,97 3700,1,1,1998/10/01 06:00:00,139.9123053021,35.753511987,1,10,4112107,10,97,33,,97 7300,1,1,1998/10/01 06:00:00,139.9132597066,35.7134959947,1,7,4114009,8 ,97,40,,97 5500,1,1,1998/10/01 06:00:00,139.9374260851,35.7387718937,2,12,4113004,14,97,32,,97 9500,1,1,1998/10/01 06:00:00,139.9268670539,35.6868715236,1,2,4115011,12,97,26,,97 9700,1,1,1998/10/01 06:00:00,139.9238668934,35.6892555155,2,6,4115016,14,97,32,,97 11400,1,1,1998/10/01 06:00:00,139.9293917865,35.6808909812,1,6,4115107,9 ,97,36,,97 11800,1,1,1998/10/01 06:00:00,139.9077829215,35.6792209637,2,6,4115202,14,97,21,,97 10100,1,1,1998/10/01 06:00:00,139.9298447577,35.684551261,1,1,4115014,12,97,26,,97
Input Output
time-series data(CSV) Route data(KML) Movie(MP4) Mesh data(CSV) Polygon data(KML) time-series data(CSV)
Export so many many PNG imageries and create GIF animation.
Population aging rate 2010 - 2035 Kesenuma which has big earthquake in 2011
People Flow 2008 in Tokyo
Take so much time and have to remake again and again every time a new attribute is added.
Using Mobmap for Google Chrome
Satoshi Ueyama
EDITORIA, The University of Tokyo
http://shiba.iis.u-tokyo.ac.jp/member/ueyama/mm/
1500,1,1,1998/10/01 06:00:00,139.9249985549,35.7318406842,2,7,4110309,14,97,33,,97 3700,1,1,1998/10/01 06:00:00,139.9123053021,35.753511987,1,10,4112107,10,97,33,,97 7300,1,1,1998/10/01 06:00:00,139.9132597066,35.7134959947,1,7,4114009,8 ,97,40,,97 5500,1,1,1998/10/01 06:00:00,139.9374260851,35.7387718937,2,12,4113004,14,97,32,,97 9500,1,1,1998/10/01 06:00:00,139.9268670539,35.6868715236,1,2,4115011,12,97,26,,97 9700,1,1,1998/10/01 06:00:00,139.9238668934,35.6892555155,2,6,4115016,14,97,32,,97 11400,1,1,1998/10/01 06:00:00,139.9293917865,35.6808909812,1,6,4115107,9 ,97,36,,97 11800,1,1,1998/10/01 06:00:00,139.9077829215,35.6792209637,2,6,4115202,14,97,21,,97 10100,1,1,1998/10/01 06:00:00,139.9298447577,35.684551261,1,1,4115014,12,97,26,,97
There are "Play", "Stop", "forwarding" button like a movies player. Each object begins to move when the “Play” button is clicked.
Following four attributes are necessary for using Mobmap. "id" (user ID), "date" (time information), "lat", "lon"
Change ”Dark” color Check
In the case of plural conditions category=4 || category = 8 OR sentense(or) AND sentense(and) category<4 && category > 1
Deselecting select of the polygon select of the rectangle select of the line gate
Choose a movement object from the select button
Mobmap can export trajectory data as well. Link data also can be exported as mL format.
Animation export
By the default setting, output a share for ten minutes in animation reproduction one second. eg: In the case of 15sec, it is 150min
You can check population volume in time series and an abnormal movement easily.
Population aging rate 2016
Population aging rate 2025
You can import your time-series data which has time stamp.
Ex) GPS data tracked by My Tracks (Android App)
Ex) GPS data tracked by My Tracks (Android App)
You can import your time-series data which has time stamp.
Practice data① Simulated People Flow data
Practice data① Simulated People Flow data
Simulated People Flow data is made from geo- tagged Tweet data(presented by Nightlei Co.,
Ltd.) I'm at Ramen Jiro Meguro shop (Meguro-ku) 139.707142710686 35.6341373645078 ex)
Practice data① Simulated People Flow data
This data is created as following estimation and interpolation methods from geo-tagged Tweet data. ・Home estimate ・Stay time estimation ・Path interpolation
Home place is defined as a city and district which users have frequently checked in on morning and a holiday. Finally, the place is determined at random in the city. Virtual stay time is set in advance per category
Paths are interpolated based on the places between check-in places using road data (cooperation: Hiroshi kanasugi, People Flow Team at Tokyo University CSIS)
Raw geo tagged tweet data on a map (without the interpolations)
Home place and stay time are given to geo tagged tweet data according to the check-in on map (night-time).
Virtual stay time per about 250 check-in place category
Paths are interpolated (only in the road) for creating Simulated People Flow data per 5 min using INFORMATION PLATFORM FOR PEOPLE FLOW ANALYSIS by the university of Tokyo CSIS.
"STUDY OF INFORMATION PLATFORM FOR PEOPLE FLOW ANALYSIS IN URBAN AREA", the 36th Japan Society of Civil Engineering information use technology symposium, pp.111-114, 2011 about Yoshihide Sekimoto, your Satoshi Usui Hiroshi kanasugi, Yusuke Masuda,
If you want to know more, check our twitter!
Using Mobmap, We learned the method to visualise and analyze GIS data with the time-series data. This exercise provide for simulated people flow data as sample data. Also, you can handle your own data as well.
Please answer following questionnaire to improve Mobmap and hands on in future.
Thanks
For creating data and this exercise, Hiroshi Kanasugi helped us to interpolate and create the Simulated People Flow data. The Simulated data is made from the geo tagged tweet data by Ishikawa, Nightlei Co., Ltd.. We appreciate them.