
SLIDE 1
MIXING AND MATCHING: COMPOSITION AND DIVERSITY OF COMMERCIALLY AVAILABLE SEED MIXES COMPARED WITH REMNANT AND RESTORED TALLGRASS PRAIRIES
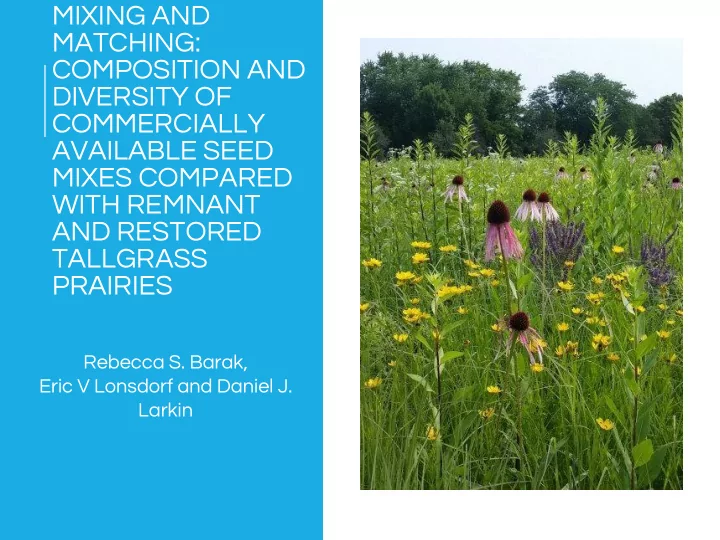
Rebecca S. Barak, Eric V Lonsdorf and Daniel J. Larkin
MIXING AND MATCHING: COMPOSITION AND DIVERSITY OF COMMERCIALLY - - PowerPoint PPT Presentation
MIXING AND MATCHING: COMPOSITION AND DIVERSITY OF COMMERCIALLY AVAILABLE SEED MIXES COMPARED WITH REMNANT AND RESTORED TALLGRASS PRAIRIES Rebecca S. Barak, Eric V Lonsdorf and Daniel J. Larkin NATIONAL NATIVE SEED STRATEGY Action
Rebecca S. Barak, Eric V Lonsdorf and Daniel J. Larkin
Constraints
Objectives
(conservatism)
mix,” and “native prairie seed mix”
and seed mix (ecosystem service, cost, seed rate, etc.)
seed rate, price for 4-5 mixes per company
Gabi Carr NU 2017
Gabi Carr NU 2017
Restored prairies
Remnant prairies
and Jones)
Commercial seed mixes had significantly lower species richness than remnant or restored prairies Species richness of seed mixes ranged from 5-93 species (mean = 30)
Commercial seed mixes had significantly lower species richness than remnant or restored prairies Species richness of seed mixes ranged from 14-91 species (mean = 34.25)
F = 22.97, P < 0.0001
Commercial mixes had lower richness than both remnant and restored prairies (P=0.0002)
F = 9.77, P = 0.0001
Coefficient of conservatism 0 – 10 Habitat fidelity, disturbance tolerance
F = 59.05, P < 0.0001 Commercial seed mixes had higher mean C than remnants and restored prairies (P < 0.009).
Asteracea e Sunflowers Cyperacea e Sedges Fabacea e Legumes Poaceae Grassse Monocot s Dicots 300 commercially available prairie species Time since last common ancestor
Asterace ae Cyperace ae Fabacea e Poaceae Time since last common ancestor Asteracea e Sunflowers Cyperacea e Sedges Fabacea e Legumes Poaceae Grassse
Time since last common ancestor Asteracea e Sunflowers Cyperacea e Sedges Fabacea e Legumes Poaceae Grassse
Asteracea e Sunflowers Cyperacea e Sedges Fabacea e Legumes Poaceae Grassse Time since last common ancestor
(Cadotte, Cardinale & Oakley 2008; Davies, Cavender-Bares & Deacon 2011; Cadotte, Dinnage & Tilman 2012; Dinnage et al. 2012; Li et al. 2015; Lind et
F = 21.05, P < 0.0001 Commercial mixes had lower phylogenetic diversity than remnants (P < 0.0001) , but didn’t differ from restored prairies (P = 0.94)
These mixes were (probably) not designed to maximize these multiple measures of biodiversity!
What if you want to meet all these objectives at once?
(conservatism)
How do you deal with these objectives all at
(conservatism)
This is a MULTI-OBJECTIVE RESTORATION PROBLEM
meet multiple biodiversity objectives?
with prairies themselves?
“Fitness” is based
the objective function
Individual = seed mix “Fitness” = similarity to objective function Objective function = Species richness C value Bloom time diversity Phylogenetic diversity
tree)
Scenario
Photo: Justin Meissen
Photos: USDA Plants
Indiangrass Big bluestem
Photos: USDA Plants
Germination & Establishment Not all planted species become part of the realized community
seed mix (Grman et al. 2015)
found at sites
Comparing computer designed results to ready-made mixes
Working in additional traits (i.e., establishment!)
Increasing customizability
Creating a (useful) decision-support tool for restoration design
Email: BeckyBarak@u.northwestern.edu Twitter: @BeckSamBar
Gabi Carr, Meghan Kramer, Taran Lichtenberger, Jessica Riebkes, Bob Sherman, Alyssa Wellman-Houde, The Larkin Lab, The Kramer-Havens Lab, The ladies of Plant Community Ecology Program in Plant Biology and Conservation, Illinois Association of Environmental Professionals, Society for Ecological Restoration Midwest-Great Lakes, NSF DEB-1354426 and REU at Chicago Botanic Garden and Morton Arboretum
The preceding presentation was delivered at the This and additional presentations available at http://nativeseed.info