
SLIDE 1
Mitigation Rachel Freeman (Tyndall Centre for Climate Change - - PowerPoint PPT Presentation
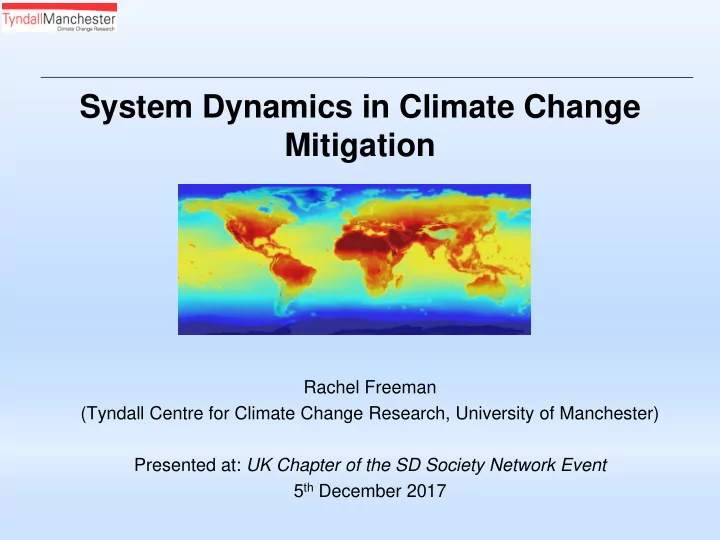
System Dynamics in Climate Change Mitigation Rachel Freeman (Tyndall Centre for Climate Change Research, University of Manchester) Presented at: UK Chapter of the SD Society Network Event 5 th December 2017 Welcome Housekeeping The
2
3
13:00 – 13:15 Arrivals, lunch available 13:15 – 13.35 Rachel Freeman
to SD, use of SD in climate mitigation 13:35 – 14:00 Martin Reynolds, Open University A critical systems view of sustainability 14:00 – 14:25 Frank Boons, University
Circular economy and climate change – a social science view 14:25 – 14:50 Daniel Schein, University of Bristol SD modelling of the environmental impact of digital media 14:50 – 15:05 Refreshment Break 15:05 – 15:20 John Broderick, University of Manchester Using C-Roads to teach about climate change mitigation 15:20 – 15:35 Panel Plenary discussion: *Examples of climate change mitigation *Causal issues common to the examples – critical systems concepts, social science concepts, technology, economy,
15:35 – 15:45 Rachel Freeman Introduction to group model building 15:45 – 16:30 Group model building session in small groups, refreshments available 16:30 – 16:45 Presentations from the small groups 16:45 – 17:00 Plenary – general discussion and wrap up
5
7
8
9
11
1 G. P. Richardson, “Reflections on the foundations of system dynamics,” System Dynamics Review, vol. 27, no. 3, pp. 219–243, 2011 2 J. W. Forrester, “System dynamics , systems thinking , and soft OR,” System Dynamics Review, vol. 10, no. 2–3, pp. 245–256, 1994. 3 J. Sterman, Business dynamics : systems thinking and modeling for a complex world. Boston ; London: Irwin/McGraw-Hill, 2000
12
A B +
C D
F
13
ice cream sales murder rate +
ice cream sales murder rate average temperature + +
birth rate population death rate average lifetime fractional birth rate
R B
Births/population/year
14
fractional birth rate fractional death rate R B Population births deaths + + + +
15
Stepp, M. D., Winebrake, J. J., Hawker, J. S., & Skerlos, S. J. (2009). Greenhouse gas mitigation policies and the transportation sector: The role of feedback effects on policy effectiveness. Energy Policy, 37(7), 2774–2787
Anand, S., Vrat, P., & Dahiya, R. P. (2006). Application of a system dynamics approach for assessment and mitigation
16
Arable Land initial arable land urban and industrial land development time urban and industrial land required average life of land Land Fertility inherent land fertility land fertility regeneration time initial land fertility Potentially Arable Land development cost per hectare initial potentially arable land Urban and Industrial Land fraction of agricultural inputs allocated to land development initial urban and industrial land land erosion rate <total agricultural investment> land development rate land removal for urban and industrial use development cost per hectare table potentially arable land total fraction of agricultural inputs allocated to land development table <marginal productivity
marginal productivity
<land yield> social discount average life of land normal land life multiplier from land yield <land life multiplier from land yield 1> <land life multiplier from land yield 2> <land life policy implementation time s> <Time> land fertility degredation rate land fertility regeneration time table land fertility regeneration land fertility degredation <fraction of agricultural inputs for land maintenance> land fertility degredation rate table <persistent pollution index> <population> urban and industrial land required per capita <industrial output per capita> urban and industrial land required per capita table <one year> <GDP pc unit>
17
18
level of atmospheric greenhouse gases Natural systems on land and below water rate of ecosystem regeneration GHG from agriculture rate of GHG emissions from ecosystems GHG in fossil fuels rate of GHG emissions from fossil fuels rate of GHG take up in ecosystems fossil fuel use + climate change impacts +
impacts threshold multiplier (1.5, 2.0, 3-4 degrees) + human consumption
availability of natural systems services + + R1 B1 R2 direct negative impacts on ecosystems
B3 human population + +
20
22
23
24