
SLIDE 1
Final Master of Engineering Group Presentation – Ghana Team May 30th, 2008
MIT Clean Water 4 All, Inc. Final Master of Engineering Group - - PowerPoint PPT Presentation
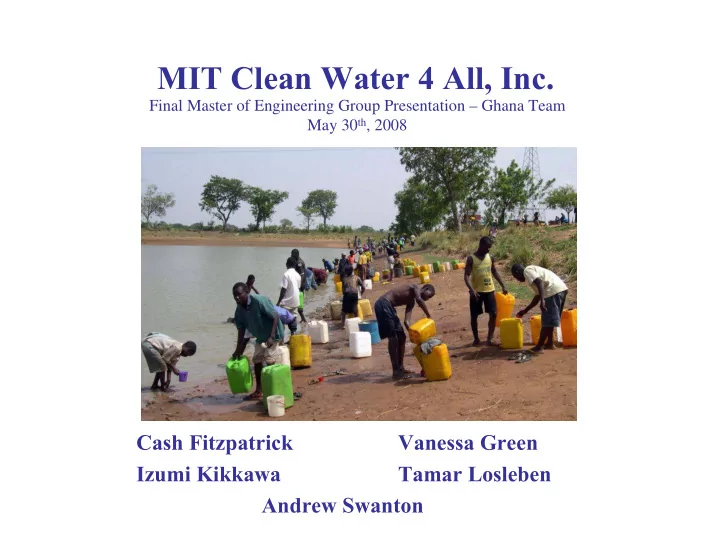
MIT Clean Water 4 All, Inc. Final Master of Engineering Group Presentation Ghana Team May 30 th , 2008 Cash Fitzpatrick Vanessa Green Izumi Kikkawa Tamar Losleben Andrew Swanton MIT Clean Water 4 All, Inc. Presentation Outline Ghana:
Final Master of Engineering Group Presentation – Ghana Team May 30th, 2008
MIT Clean Water 4 All, Inc.
Percentage of Households by region (Drinking w ater as biggest problem)
0.0 5.0 10.0 15.0 20.0 25.0
G r e a t e r A c c r a V
t a A s h a n t i B r
g A h a f
t h e r n U p p e r E a s t U p p e r W e s t
%
(National Statistical Services Survey -CWIQ 2003)
MIT Clean Water 4 All, Inc.
Source: Foran, 2007
E-Coli, Total Coliform, and Turbidity of Raw Water Samples from Selected Dugouts During the Rainy Season in Tamale and Savelugu Districts
Dungu Dam
MIT Clean Water 4 All, Inc.
MIT Clean Water 4 All, Inc.
Pilot Study of Horizontal Roughing Filtration in Northern Ghana as a Pretreatment Method for Highly Turbid Water
Tamar Rachelle Losleben
MIT Clean Water 4 All, Inc.
Photo Credit: Murcott 08
MIT Clean Water 4 All, Inc.
MIT Clean Water 4 All, Inc.
Photo Credit: Doyle 07
MIT Clean Water 4 All, Inc.
MIT Clean Water 4 All, Inc.
MIT Clean Water 4 All, Inc. Settling Test of 4 Dam Waters
20 40 60 80 100 120 140 160 180 200 1 5 2 6 9 1 2 2 4 4 8 1 4 4 1 9 2 3
Time (min) Turbidity (NTU)
17-Jan 6:10 PM Ghanasco Dam 21-Jan 12:25 PM Kunyevilla Dam 17-Jan 10:30 AM Kpanvo Dam 21-Jan 12:25 PM Gbrumani Dam 21-Jan 12:25 PM Gbrumani Dam Hand Pump
Slow sand filtration (SSF)
Pretreatment Maximum raw water turbidity:
(Wegelin, 1996; Galvis 1993)
20-50 NTU
Dry Season Rainy Season Average E.Coli (CFU/100 mL) 779 438 Average Total Coliform (CFU/100 mL) 26,357 12,797 Average Turbidity 248 NTU 931 NTU Raw Dugout Samples in Tamale and Savelugu Districts (Foran, 2007)
99-99.99% removal of microorganisms
(Wegelin, 1996)
MIT Clean Water 4 All, Inc.
Particle removal mechanisms in HRF (Wegelin, 1996)
Photo Credit: Christian- Murtie 07
Chirifoyili HRF
MIT Clean Water 4 All, Inc.
Photo Credit: Carl Allen 08
MIT Clean Water 4 All, Inc.
Effluent flows to soak-away drainage 1 inch PVC pipe 1 inch PVC elbow Cinderblocks and adobe bricks 700 L Polytank 4 inch PVC elbow 1 inch valve (brass gate or PVC ball) 4 inch to 1 inch PVC reducer 95 cm 91.5 cm 54 cm
12 –18 mm 4–8 mm 8 –12 mm 4 inch PVC pipe 3.5 m 2.5 m 1.0 m
MIT Clean Water 4 All, Inc.
MIT Clean Water 4 All, Inc.
Pilot HRF Settling Test
50 100 150 200 250 15 20 60 90 120 240 480 1440 1920 3000
Time (min) Turbidity (NTU)
22-Jan 5:26 PM G Granite Gravel 24-Jan G Granite Gravel 22-Jan 5:26 PM D Local Gravel 24-Jan D Local Gravel 22-Jan 5:26 PM P Broken Pottery 24-Jan P Broken Pottery 16-Jan 5:10 PM G tank 22-Jan 5:26 PM G tank no mix 24-Jan G tank no mix 22-Jan 5:26 PM G tank mixed 24-Jan G tank mixed 16-Jan 5:10 PM P tank 24-Jan P tank no mix 24-Jan P tank mixed
E A C B
Average HRF effluent turbidity Average filtration rates (ml/min) Average additional turbidity removed by HRF after settling Average % additional turbidity removed by HRF after settling Average % total HRF turbidity reduction Filtration coefficient , λ (min^-1) G granite gravel 51 NTU 220 (1.6 m/hr) 46 TU 61 % 84 % 0.002 D local gravel 72 NTU 170 (1.3 m/hr) 30 TU 47 % 76 % 0.0007 P broken pottery 61 NTU 200 (1.5 m/hr) 18 TU 55 % 80 % 0.0006 Goal: < 50 NTU 41-270 (0.3-2.0 m/h)
50 100 150 200 250 1 min 2 min 3 min
Filtration Time (min) Filtered Water Volume (ml)
AVERAGE G Granite Gravel AVERAGE D Local Gravel AVERAGE P Broken Pottery AVERAGE Mix and Settled G tank AVERAGE Mix and Settled P tank 1-Feb Mafi HRF Inflow 1-Feb Mafi HRF Outflow
MIT Clean Water 4 All, Inc.
(Sylvain, 2006)
http://aochycos.ird.ne/HTMLF/ETUDES/HYDRO/LOUMBILA.HTM
Blue Nile Health Project, Sudan (referenced by Wegelin, 1996) Ghanasco Dam, Tamale, Northern Ghana (Losleben, 2008) Ouagadougou , Burkina Faso (Sylvain, 1989) Media broken burnt bricks gravel granite gravel G local gravel D broken pottery P quartz gravel Average filtration rate (m/h) 0.30 1.6 1.3 1.5 1.0 Filter length and media size (mm) 270 cm, 30-50 85 cm, 15-20 85 cm, 5-10 350 cm, 12-18 250 cm, 8-12 100 cm, 4-8 400 cm, 15- 25 150 cm, 5-15 Raw water turbidity 40-500 NTU 313 NTU 301 NTU 301 NTU 5-50 NTU Prefiltered water turbidity 5-50 NTU 51 NTU 72 NTU 61 NTU 4-19 NTU Faecal coliforms* (/100ml) Raw water > 300
8400 8400
< 25
500
77 % 87 % 84 % 76 % 80 % 32 %
* as E.coli
MIT Clean Water 4 All, Inc.
Kunyevilla Channel
(Wegelin, 1996)
Slow Sand Filter Raw Dugout Water Granite Gravel
22.5 m 6.4 m 16.1 m 2 m
Q = 75,000 L/day
700 NTU Total Channel Length 45 m 20 NTU λ = 0.13 hr^-1
q = 1.6 m/h
44 m 1 m 2.6 m
1 m
MIT Clean Water 4 All, Inc.
MIT Clean Water 4 All, Inc.
– does not suite treatment of high turbid water » Decline in treatment efficiency, frequent clogging and maintenance requirement
Diagram of Biosand Filter
MIT Clean Water 4 All, Inc.
47 cm
5 cm 10 cm
1) B.J.Buzunis, Intermittently Operated Slow Sand Filtration: A New Water Treatment Process, March 1995
Turbidity E.Coli Total Coliform flow rate
MIT Clean Water 4 All, Inc.
Evaluation:
10 15 20 25 30 35 40 45 0 4 8 10 12 15 17 19 21 23 25 27 31 33 35 38 42 45 Flow Rate [L/hr] Day BSF A BSF A' BSF B BSF C
LPD BSF average flow rate [L/hr] (standard deviation) A (without modification) 32.0 (4.1) A' (without modification) 25.9 (4.9) B (additional 5 cm sand layer) 21.8 (6.0) C (additional 10 cm sand layer) 21.1 (4.3)
Design flow rate ~ 20 L/hr Upper limit 30 L/hr Lower limit 5 L/hr no decline in flow rate
MIT Clean Water 4 All, Inc.
100 200 300 400 500 7 9 11 15 17 19 21 23 25 27 31 33 35 42 44 Turbidity [NTU] Day Dugout BSF A BSF A' BSF B BSF C
After day 13 MIT Clean Water 4 All, Inc.
Variation in operation? Need for cleaning?
Dugout and BSF Average turbidity [NTU] (standard deviation) Dugout 306 (97) A (without modification) 22 (17) A' (without modification) 20 (14) B (additional 5 cm sand layer) 15 (6.8) C (additional 10 cm sand layer) 14 (1.4)
40% 50% 60% 70% 80% 90% 100% 7 9 11 15 17 19 21 23 25 27 31 33 35 42 44 Turbidity Removal [%] Day
BSF A BSF A' BSF B BSF C
BSF average turbidity removal (standard deviation) A (without modification) 92 % (7 %) A' (without modification) 93 % (6 %) B (additional 5 cm sand layer) 95 % (2 %) C (additional 10 cm sand layer) 95 % (1 %) After day 13
Variation in operation? Need for cleaning?
MIT Clean Water 4 All, Inc.
Day 30 38 43 46 Dugout 30000 Present Present Present BSF A Present Absent BSF A' 300 Absent Absent Present BSF B 200 Absent Absent BSF C Present Absent
0.0 0.5 1.0 1.5 2.0 7 8 9 10 11 Log10 Total Coliform Removal Day BSF A BSF A' BSF B BSF C
Hydrogen Sulfide Bacteria; Presence/Absence
MIT Clean Water 4 All, Inc.
Due to additional basin with sand
– Decline in BSF A & A’: operation conditions ? cleaning? – No decline in BSF B & C: could be benefit of modification
Able to withstand more operational variation, or less frequent cleaning
MIT Clean Water 4 All, Inc.
MIT Clean Water 4 All, Inc.
40.6 cm 19 cm 5 cm 51 cm Superfine sand 5.1 cm Gravel 5.7 cm Fine sand 37.5 cm Coarse sand 5.1 cm 25.4 cm Height 75cm Diffuser basin Water level Outlet
2 4 6 8 10 10 20 30 40 Number of Households Flow Rate [L/hr]
MIT Clean Water 4 All, Inc.
10 20 30 40 50 60 70 80 90 100 5 10 15 Removal of Turbidity [%] Household
10 20 30 40 50 60 5 10 15 Turbidity [NTU] Household influent effluent 1 2 3 4 5 6 7 8 9 10 30 40 50 60 70 80 90 100 Number of Households Turbidity Removal [%]
MIT Clean Water 4 All, Inc.
Average Removal 1.9Log10 units, 95 % Average Effluent 710 cfu/100 ml
0.0 1.0 2.0 3.0 4.0 5.0 6.0 1 3 5 7 9 11 13 15 17 19 21 log10 Total Coliform [log10 cfu/100ml] Household influent effluent 1 2 3 4 5 6 7 Number of Households log10 Removal of Total Coliform 60 65 70 75 80 85 90 95 100 2 4 6 8 10 12 14 16 18 20 22 Total Coliform Removal [%] Household
MIT Clean Water 4 All, Inc.
detected in 9/22 samples (influent) average influent 960 cfu/100 ml (9 samples) 55 % removal
MIT Clean Water 4 All, Inc.
MIT Clean Water 4 All, Inc. Locally Plastic Design BSFs HydrAid BSFs unmodified; modified Design Flow Rate 15-20 L/hr 47 L/hr Measured Flow Rate 29 L/hr; 21 L/hr 17 L/hr * Turbidity influent 227 TU 32 NTU effluent 16 TU; 11 TU 2.9 NTU removal 93 %; 95 % 87% Total Coliform influent 15,000 cfu/100ml 20,000 cfu/100ml effluent 430 cfu/100 ml ** 710 cfu/100ml removal 87 % ** 95% Cost $ 16 - $ 25 $ 50 - $ 65
* Not measured at maximum head ** Average values on Day 11 *** Average value after 30+ days of operation
Local Plastic Design Biosand Filter Summary:
MIT Clean Water 4 All, Inc.
– To take Pulsar 1 System* and convert it for drinking water usage for community scale chlorination – Based on current capacity, need to significantly lower
– Compare different chlorine options (community scale versus household scale)
* Pulsar 1 system is unique in being a highly accurate chlorine dosing system that does not require electricity (gravity feed). It was designed for large-scale swimming pools, but we hypothesized that it might be appropriate to adapt for developing country contexts such as schools, hospitals, and rural communities.
MIT Clean Water 4 All, Inc.
MIT Clean Water 4 All, Inc.
MIT Clean Water 4 All, Inc.
Pulsar 1 Unit Water Source: Elevated Tank
MIT Clean Water 4 All, Inc.
2 4 6 8 10 12 20 40 60 80 100 Inlet Ball Valve Orientation (% Open) Free Chlorine Residual (ppm)
MIT Clean Water 4 All, Inc.
MIT Clean Water 4 All, Inc.
MIT Clean Water 4 All, Inc.
1 2 3 4 5 6 7 8 30 60 90 120 150 180 210 Time (sec) Free Chlorine Residual (ppm)
MIT Clean Water 4 All, Inc.
0.01 0.1 1 10 100 1000 H T H K
i m f i l t e r t r e a t e d w a t e r ( r u r a l ) P i p e d G h a n a W a t e r C
p a n y w a t e r K
i m f i l t e r t r e a t e d w a t e r ( u r b a n ) A q u a t a b s ( 2 L t a b l e t ) C l e a r W a t e r T a n k e d w a t e r v i a t h i r d p a r t y B i
a n d , P l a s t i c H a n d
i e d s a c h e t w a t e r F a c t
y
r
u c e d s a c h e t w a t e r ( W h
e s a l e ) F a c t
y
r
u c e d s a c h e t w a t e r ( I n d i v i d u a l P a c k a g e ) B
t l e d W a t e r ( I n d i v i d u a l 1 . 5 L )
Treatment Cost ($/m3)
MIT Clean Water 4 All, Inc.
MIT Clean Water 4 All, Inc.
0.017 3.0 0.01 0.1 1 10 Pulsar 1 + HTH Kosim + Aquatabs NPV of System Cost ($/m3)
MIT Clean Water 4 All, Inc.
MIT Clean Water 4 All, Inc.
Northern Region, Ghana
have the greatest impact on local drinking water quality based on product effectiveness, adoption and sustained use
MIT Clean Water 4 All, Inc.
Team included: Vanessa Green, Gaetan Bonhomme, Avani Kadakia, Gabriel Shapiro, Matt Thomson, Musah Abdul-Wahab, Jaafar Pelpo, Ibrahim Mohammed Ali, Alhassan Tahiru Senini & Susan Murcott
MIT Clean Water 4 All, Inc.
Type Gender (% Female) Religion (% Muslim)
House Type (Roof) Education
Average Household Size % Tin % Thatch Primary Secondary Urban (n=118) 77% 94% 100% 5% 51% 31% 12 Rural (n=119) 70% 86% 15% 97% 19% 3% 13
Low rural education
MIT Clean Water 4 All, Inc.
Significant difference in house type between rural and rural communities Similar household size, urban result different from previous work in middle income areas
MIT Clean Water 4 All, Inc.
58% 54% 27% 23% 19% 14% 0% 50% 100% R ainwater C
Private Household T ap Other (Improved)* Dugout/Dam Public S tandpipe T anker Truck Water
* T yicallya neighbor's household tap
93% 63% 50% 20% 4% 4% 0% 50% 100% Dugout/Dam Borehole R ainwater C
Public S tandpipe Protected Dug Well Protected S pring
Primary Urban Water Sources Primary Rural Water Sources
rural respondents collect rainwater
water from a private tap or a neighbor (infrequent flow, taps
a dugout, some access boreholes / standpipes
Key Challenges:
Urban: Water Quantity & Recontamination Rural: Source Distance & Water Quality
MIT Clean Water 4 All, Inc.
10.2% 1.4% 1.4% 9.9% 1.8% 3.0%
0% 2% 4% 6% 8% 10% 12% Individuals ≤ 5 Individuals 6-17 Individuals ≥18 % experiencing diarrhea in the past week
Urban R ural
Type Turbidity Total Coliform (TC)
Ave. (TU) Max. (TU) % with CFU % >1000 (CFU / 100ml) Ave. (CFU/ 100ml) % With E.Coli Ave. (CFU/ 100 ml) Urban (n=118) <5 <5 59% 26% 2,500 8% 47 Rural (n=119) 238 1000 89% 82% 18,800 26% 172
Health: Diarrheal Incidence
Recontamination remains a challenge
High diarrheal incidence among both urban and rural respondents, especially among children under five
Household Drinking Water Quality
Highly turbid source water, and significant contamination
96% 20% 26% 8% 3% 0% 1% 0% 8% 93% 47% 42% 9% 3% 0% 0%
0% 25% 50% 75% 100% G WC Municipal Water C loth Filter S ettling in Vessel Alum Boiling C hemicals C eramic Filter C andle Filter % Utilization
Urban R ural
Urban and Rural Water Treatment Methods “We use alum only when the water becomes very muddy at the end of the dry season” –Rural resident, Lahagu.
MIT Clean Water 4 All, Inc.
Significant adoption
areas where distributed Limited use of other treatment products, with the notable exception of alum in rural areas
MIT Clean Water 4 All, Inc.
72% 93% 73% 41% 81% 70% 80% 46% 98% 47% 91% 38% 32% 6% 0% 0%
0% 25% 50% 75% 100% F irewood C harcoal Bicycle Motorcycle Mobile phone T elevision E lectricity Water T ap % Ownership
Urban R ural C
uel T ransportation E lectronics Utilities
Urban Households:
Rural Households:
“If you are going to bring an expensive filter to this village you need to bring it at the time
finished farming” – Rural respondent, Golinga. Urban and Rural Ownership of Household Goods Difference in Investment Type
Note: Ability to pay calculation assumes that 5% of daily income allocated to water
0% 25% 50% 75% 100%
Market Day S treet Vendors S pecialty S tore Roadside S tand General S tore Door-to-Door
Urban Purc has e Loc ation Prefer to Purchase Typically Purchase 0% 25% 50% 75% 100%
Market Day S treet Vendors S pecialty S tore Roadside S tand General S tore Door-to-Door
R ural Purc has e Loc ation Prefer to Purchase Typically Purchase
“For items that I buy often I would like door-to-door
community.” – Rural respondent, Golinga. “I always buy at the market because I assume that is where I can get the best price” – Rural respondent, Golinga..
MIT Clean Water 4 All, Inc.
Rural Attribute Importance
Water Look/T aste 7% P roduct T ype 17% 66% T reatment S peed 5% P rice 5% Water Look/T aste 10% P roduct T ype 19% 57% T reatment S peed 8% P rice 6%
Urban Attribute Importance
attributes selected had on a respondent’s overall product preferences; Urban and rural communities had similar attribute importance rankings
Health Improvement Health Improvement
Source: G-lab Final Report, February 2008
MIT Clean Water 4 All, Inc.
0.5
0.0 0.1 0.6
0.7
1.0
Low C
High C
Turbid/ E arthy Clear/ C hlorine C lear/ E arthy C lear/ C risp >30 Minutes <30 Minutes Modern Durable C
Traditional Durable Minor Improvement Major Improvement
0.1
0.3
0.2
0.2
1.0
P roduct Type Time to Treat Water Taste & Look P roduct P rice Health Impact*
Urban C
umer Preference
Dislike P refer
3.2
R ural C
umer Preference
Dislike P refer
3.1
important to both urban and rural respondents
favored (respondents want something that will last)
more important in urban
clear/crisp (urban) and clear/ chlorine (rural)
in urban areas, limited price sensitivity in rural
MIT Clean Water 4 All, Inc.
Note: Annual cost per family was estimated by calculating using an anticipated average household size of 12 individuals and 2 liters of drinking water per individual per day. Type Household Water Product Turbidity Efficacy Microbial Efficacy Local Availability Annual cost (GHC) / family* Particle Removal Cloth Filter Low Low High 0.0 Alum High Low-Moderate High 2.2 BioSand Filter Local LDP High Moderate Low 10
High Moderate Low-Moderate 22 Particle Removal & Safe Storage Pot Filter (Kosim) High Moderate High 10 Candle Filter OK High Moderate Moderate 14 Mission High Moderate Low 50 Berkefeld High Moderate Moderate 136 Disinfection SODIS (UV) Low Low-Moderate Moderate 8 HTH Chlorine Low High Low 0.3 Liquid Chlorine Low High Low 2 – 5 Aquatabs (20l) Low High Low-Moderate 13 Coagulation & Disinfection PuRTM (P&G) High High N /A 45 - 80 Safe Storage Locally Manufactured N / A N / A Low 1.2 CDC (SWS) N / A N / A Low 2.4 Sachet Water Hand-tied (single) N / A N / A High 275 Factory (wholesale) N / A N / A High 657
MIT Clean Water 4 All, Inc.
potential in the short term as they are low-cost, they effectively reduce turbidity (and microbial contamination), and are available in northern Ghana.
– The OK candle filter and biosand filters (locally manufactured and International Aid) have longer term potential
atmospheric dust seen in northern Ghana, and thus chlorine disinfection emerges as the priority option.
– Chlorine disinfection is less effective in water with turbidities >30 NTU, thus in rural areas with turbid source water chlorination should be used in conjunction with particle removal – PuRTM offers a simple solution as it combines both particle removal and disinfection in a single sachet; however, the relatively high-cost and lack of availability in the region reduces the attractiveness of this option
protection from recontamination, particularly if used in conjunction with chlorine disinfection.
as well as sachet water product should be targeted to upper and middle class MIT Clean Water 4 All, Inc.
– To facilitate the development of targeted HWTS interventions – To promote product adoption and sustained use
– The vertical axis is source water, defined by community location and water quality – The horizontal axis is profession which serves as proxy for both income and daily activity
Housewife Agricultural Production Worker Sales & Other Trader Profess- ional
Urban Rural Clear Water Turbid Water
SOURCE WATER RESPONDENT PROFESSION
MIT Clean Water 4 All, Inc.
Priority HWTS products were matched with each segment based on
3) consumer preferences
Housewife Agriculture Produc- tion Sales & Other Trader Profess- ional
Urban Rural Clear Water Turbid Water
N = 62
1
SOURCE WATER RESPONDENT PROFESSION
2b 3b 3a
Agricultural / Clear Water (<10 TU) Urban High-Income Rural Traders / Salespeople Agricultural / Turbid Water (>10 TU)
1
Urban Workers
2a
N = 46 N = 58 N = 66 Alum, chlorine & safe storage N = 42 Ceramic pot (or biosand) with chlorine & safe storage Alum, chlorine & safe storage Opportunity for high cost products (e.g., modern durable and sachet) Chlorine & safe storage Chlorine & safe storage N = 25
MIT Clean Water 4 All, Inc.
traditional durable, significant recontamination challenge
product (e.g., HTH or Liquid Chlorine)
non-turbid water – specifically dosing within 24h of consumption to combat recontamination due to long storage
communities with turbid source water (e.g., Alum / Biosand / Kosim + Chlorine Disinfection (Aquatabs)
water, and continue to develop the biosand for this market
1 2a 2b 1
Priority Options: Product Effectiveness, Adoption and Sustained Use Target Population
1 2a 2b 3a 3b 1 2a 2b 3a 3b 3a 3b 3b 3a
MIT Clean Water 4 All, Inc.
MIT Clean Water 4 All, Inc.
MIT Clean Water 4 All, Inc.
MIT Clean Water 4 All, Inc.
MIT Clean Water 4 All, Inc.
MIT Clean Water 4 All, Inc.
MIT Clean Water 4 All, Inc.
MIT Clean Water 4 All, Inc.
Stages of Water Treatment, Kalariga
1 10 100 1000 10000 100000 Dugout Pre-Treatment Stored Water After Filtering After Aquatabs n=1 n=1 n=24 n=24
Water Quality Values
Turbidity (TU) TC (CFU/100mL) EC (CFU/100mL)
%Red, LRV: Turb.: 89, 0.95 TC: 56, 0.36 EC: 39, 0.21 %Red, LRV: Turb.: 35, 0.19 TC: 7, 0.03 EC: 18, 0.09 %Red, LRV: Turb.: 63, 0.43 TC: 19, 0.09 EC: -49, -0.17
Stages of Water Treatment, Kakpagyili
1 10 100 1000 10000 100000 Dugout Pre-Treatment Stored Water After Filtering After Aquatabs n=2 n=2 n=35 n=35
Water Quality Values
Turbidity (TU) TC (CFU/100mL) EC (CFU/100mL)
%Red, LRV: Turb.: 92, 1.10 TC: 52, 0.32 EC: -20, -0.08 %Red, LRV: Turb.: -138, -0.38 TC: 70, 0.52 EC: -83, -0.26 %Red, LRV: Turb.: 75, 0.60 TC: 65, 0.45 EC: 90, 1.02
MIT Clean Water 4 All, Inc.
Turbidity Values During Baseline and Follow-up in Kalariga
50 100 150 200 250 300 1 3 5 7 9 11 13 15 17 19 21 23
Household Number Turbidity (TU) Filtered-only Filtered+Aquatabs
MIT Clean Water 4 All, Inc.
Turbidity Values During Baseline and Follow-up in Kakpagyili
50 100 150 200 250 300 25 27 29 31 33 35 37 39 41 43 45 47 49 51 53 55 57 59
Household Number Turbidity (TU) Filtered-only Filtered+Aquatabs
MIT Clean Water 4 All, Inc.
38/59=64% 26/59=44% Both 26/35=74% 21/35=60% Kakpagyili 12/24=50% 5/24=21% Kalariga Post-Intervention Baseline Households with No TC Detected Community 22/59=37% 10/59=17% 27/59=46% Both 16/35=46% 7/35=20% 12/35=34% Kakpagyili 6/24=25% 3/24=13% 15/24=63% Kalariga TC Count Remained the Same TC Count Increased TC Count Decreased Community
MIT Clean Water 4 All, Inc. 58/59=98% 52/59=88% Both 34/35=97% 31/35=89% Kakpagyili 24/24=100% 21/24=88% Kalariga Post-Intervention Baseline Households with No EC Detected Community
MIT Clean Water 4 All, Inc.
MIT Clean Water 4 All, Inc.
Flow Rates Comparison
1 2 3 4 5 6 7 8 9 1 2 3 4 5 6 7 Time (days) Accumulated Flow (L)
New Filters, Clear Water New Filters, Dirty Water Old Filter, Dirty Water
6,200 400 1 year Old Filter, Dirty Water 2,150-100,000 200-300 New Filters, Dirty Water New, Filters, Clear Water TC (CFU/100mL) Turbidity (TU) Age Description
MIT Clean Water 4 All, Inc.