
SLIDE 1
www.mikethicke.com I N T R O D U C T I O N Dissertation: - - PowerPoint PPT Presentation
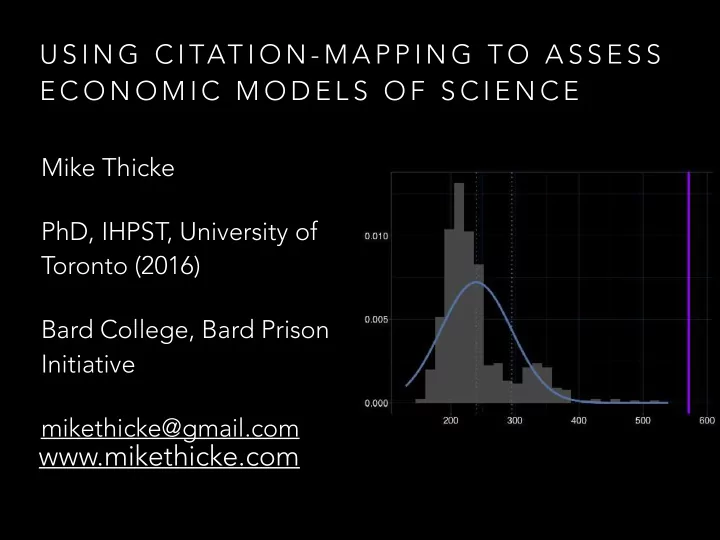
U S I N G C I TAT I O N - M A P P I N G T O A S S E S S E C O N O M I C M O D E L S O F S C I E N C E Mike Thicke PhD, IHPST, University of Toronto (2016) Bard College, Bard Prison Initiative mikethicke@gmail.com www.mikethicke.com I
P L A U S I B I L I T Y
R O B U S T N E S S
PA P E R S 4 9 9 7 M E A N 5 . 6 M E D I A N 3 1 0 % 9 0 % 1 3 9 9 % 4 1 9 9 . 9 % 1 4 6
1 a
−1 κ − 1
−1 κ − 1
P E R C E N T I L E 1 0 % 5 0 % 9 0 % 9 9 % U N I F O R M Q 3 1 6 3 8 R A N D O M A 1 5 1 7 4 1 E X T R E M E A 2 6 1 8 4 1
−1 κ − 1
−1 κ − 1