
SLIDE 1
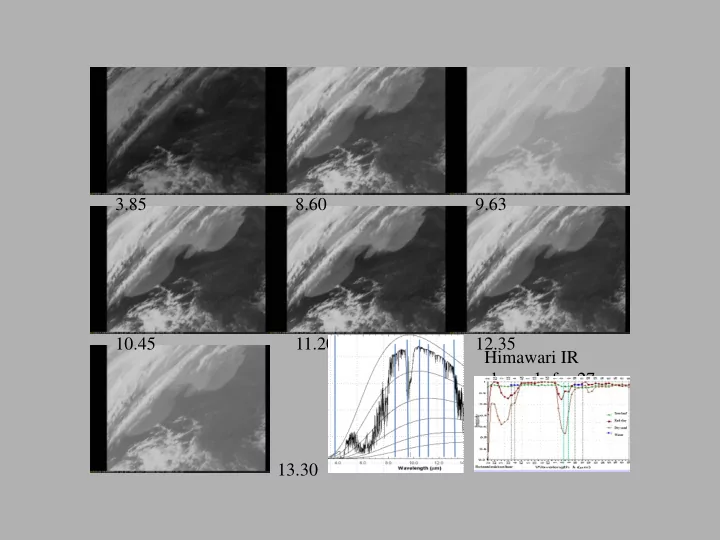
3.85 8.60 9.63 10.45 11.20 12.35 13.30 Himawari IR channels for 27 April 2015 case. Wavelength in microns
microns 13.30 P P P C C C 2 1 3 P P P C C C 4 5 6 - - PowerPoint PPT Presentation
3.85 8.60 9.63 10.45 11.20 12.35 Himawari IR channels for 27 April 2015 case. Wavelength in microns 13.30 P P P C C C 2 1 3 P P P C C C 4 5 6 Principal component (PC) images from pure IR channels only (i.e. 3.9 microns
3.85 8.60 9.63 10.45 11.20 12.35 13.30 Himawari IR channels for 27 April 2015 case. Wavelength in microns
Principal component (PC) images from pure IR channels only (i.e. 3.9 microns not used and no water vapor channels). Upper left to lower right: PC images 1-6 and RGB of PC 1,2,3 then PC 1,2,4 P C 1 P C 2 P C 3 P C 4 P C 5 P C 6
Advanced Himawari Imager Examples
Animations of the dust case just presented, but from two different viewing perspectives, with Himawari-8 imagery at 10 minute intervals on the left and FY-4 with three minute intervals on the right. While the animations overlap in time, they do not cover the same time period (himawari-8 covers a longer time period). The image sizes also differ, with FY-4 covering a larger area than Himawari-8.
Hurricane Bonnie’s warm core revealed in temperature anomaly cross section derived using NOAA-15 Advanced Microwave Sounding Unit (AMSU) data
164
Ocean color showing result of flooding interacting with pig farms. You want to be able to make daily cloud free images of this consequence of a natural disaster immediately and blend with SST, ocean currents and other information. It will be important to monitor such disasters at very high resolution to follow ocean pollution Then along came Floyd
Right: Sea level anomaly over Gulf of Mexico from satellite altimetry. To the left are maps of sea level anomaly over the equatorial Pacific showing the increase in sea level off the west Coast of South America accompanying the
Example of global wind coverage from QuikSCAT for April 1 2005. The time 20:58 UTC in the top legend indicates the most current pass in the product.
Oct 25, 1999 16:37 GMT
0 5 10 15 20 25
Wind Speed (m/s)
TRMM radar cross sections, from NASA/GSFC web site.
Earth relative animation
minute interval visible data
Severe reports, red is tornado, blue and green hail and damaging winds
Storm relative animatio n of one minute interval visible data
Earth relative animation
minute interval infrared data 33 minutes in length
Average
minutes of Earth relative infrared imagery from animation just shown
Storm relative animation
minute infrared data 33 minutes in length
Average of 33 minutes
relative infrared imagery from animation just shown
3 minute running mean loop made from infrared storm relative imagery
Stereo example remapped GOES-16 image
Stereo example remapped VIIRS image
Holding cloud streets south of storm system stationary reveals that they are lower than high based cumulus to the west of the storm
Holding cloud streets south of storm system stationary reveals that they are lower than high based cumulus to the west of the storm
375 meter resolution VIIRS visible image Let’s go beyond here next with our geostationary systems
375 meter resolution VIIRS infrared image Let’s go here next with our geostationary systems
mathematical analysis, at frequent intervals to be used in specific application areas.
tracking, severe storm identification and nowcasting in general will benefit from these advanced analysis methods.
domains of the atmospheric phenomena being observed (or oceanographic and terrestrial) dictate the spatial, spectral and temporal domains of the satellite imagery used to view and analyze that phenomena.
We have briefly addressed Principal Component Analysis, viewing rapid scan imagery in an Earth Relative and Storm, or Cloud Relative Mode, and Averaging Image Sequences to Help Diagnose Storm System Characteristics.