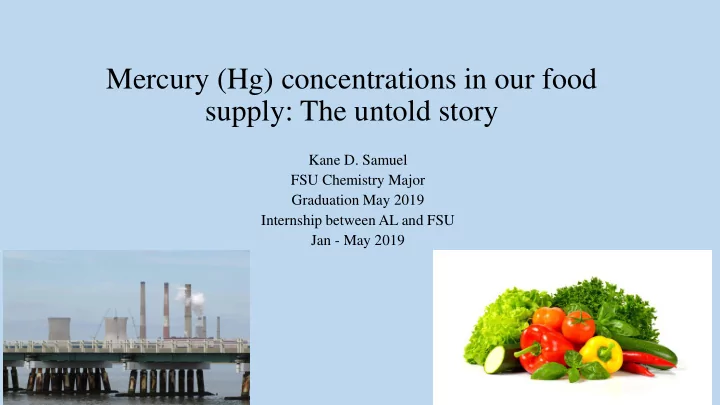

Mercury (Hg) concentrations in our food supply: The untold story Kane D. Samuel FSU Chemistry Major Graduation May 2019 Internship between AL and FSU Jan - May 2019
Background One of the most well known mercury exposure disasters was the Minamata Bay disaster in Japan in 1956. Minamata is a small industrial town on the coast of Shiranui sea. The Chisso Corporation, which is a major industrial firm in Minamata, dumped 37 tons of mercury into Minamata Bay from 1932 to 1968. As a result, many of the residents whose diets included fish from the bay, developed symptoms of methyl mercury poisoning, including birth defects and death. Since this disaster, government agencies began to issue warnings about eating fish that contained high levels of mercury. Globally, 143.8 million tonnes of seafood is consumed (Guillen 2018) USEPA’s Safe Limit: < 0.1 ug of mercury per kilogram of body weight per day. A 176-pound (80 kg) person should consume no more than 8 ug of mercury per day.
Li et al. (2018) Changed the mercury exposure paradigm beyond fish; Yui et al. (2018) showed that vegetables grown downwind of an atmospheric mercury source had elevated Hg concentrations Location Location Location Location Control Samples B1 B2 B3 B4 Sample* 21.03 +/- 19.41 +/- 9.17 +/- 7.23 +/- 0.35 +/- Lettuce 0.16* 1.16* 0.52* 0.57* 0.10 Leaf Vegatables 54.46 +/- 49.19 +/- 38.97 +/- 23.88 +/- 0.85 +/- Spinach 4.55* 0.28* 3.43* 1.28* 0.22 76.33 +/- 57.09 +/- 29.07 +/- 9.79 +/- 0.73 +/- Fruit Vegtables Tomato 5.47* 8.33* 1.45* 0.43* 0.36 21.18 +/- 4.68 +/- 1.06 +/- 0.55 +/- 0.72 +/- Grain Corn 0.67* 0.707* 0.08* 0.08* 0.19 Do vegetables grown in Maryland contain detectable concentrations of Hg?
Our two study farms and power plants in Maryland Ganoe Farm Marydel Farm
Objectives • To improve our understanding of the mercury concentrations in locally grown corn and soybeans. • To analyze the levels of mercury in fruits, vegetables, and fish sold in local grocery stores.
Methods Microwave Digestion • 0.250 grams of pulverized vegetable, fruits, grains, and fish were placed into Teflon vessels. 10 mL of Nitric acid was then added to each sample vessel. • The sample digestions were based on EPA method 7473 and analyzed using a Microwave Sample Preparation System. Total Mercury Analysis • After digestion, 100uL of each sample was pipetted into 45mL sample vials • EPA method 1631. This consisted of adding 100 uL of sample to 24.685mL of DI water, 0.125mL of BrCl, 0.03mL of Hydrolxamine (HH) and 0.06mL of SnCl2. • Tekran 2600 Mercury Analyzer
Total Mercury Concentrations Marydel Marydel Ganoe Farm Components Control Treatment Garrett County (ng/g dry weight) (ng/g dry weight) (ng/g dry weight) Corn Husk 2.6 1.4 and 1.1 1.6 Corn Leaves 15.7 and 10.8 9.2 Soils attached 37.7 and 43.6 49.1 23.8 to Roots Roots 17.8 24.0 and 22.7 24.2 Corn 0.6 0.25 and 0.20 0.19 Soybeans 0.40 and 0.39
Mercury in food Amount of mercury Food Average size (g) Concentration (ng/g) consumed (ug) Apple (1 medium size 70 8.4 +/- 2.1 0.59 apple) Carrot (1 6 inch carrot) 70 8.6 +/- 0.3 0.6 Tomato (1 medium size 170.1 4.2 +/- 2.3 0.71 tomato) Lettuce (1 cup of lettuce) 128 11.9 +/- 2.7 1.5 Spinach (1 cup of raw 128 27.7 +/- 7.7 3.5 spinach) Potato (1 medium size 150 25.7 +/- 6.7 3.8 apple) Total (just vegetables) 716 10.8 Tilapia (recommended 138.91 15.2 +/- 2.0 2.1 serving of fish) Tuna (1 can of tuna) 141.75 278.0 +/- 1.5 39.4 Total (Tilipia and 857.75 12.9 vegetables) Total (Tuna and vegetables) 280.66 50.2
Mercury in dog biscuits 9.2 + 0.4 ng Hg/g One small biscuit equals 680 grams 6,256 ng of Hg per biscuit
Do Do veg egetab ables g grown i in Mar arylan and c con ontai ain d detec ectab able con oncentrations of of Hg? Yes
Acknowledgments I would like to thank Heather Johnson and Eric Davidson for establishing the FSU-AL internship program which gave me the opportunity to work at AL. I would also like to thank Katie Kline for the opportunity to work in the water chemistry laboratory. Thank you Briana Rice for your help with the instrumentation and advice.
Health Risks of Hg 0 , Hg +2 and CH 3 Hg • Elemental mercury is a neurotoxin that impacts the central nervous system. Some neurological effects are tremors, irritability, loss of coordination and slurred speech. Very high exposures can cause kidney effects, respiratory failure and death. • Inorganic mercury is the least toxic of the three forms of mercury. It can damage the gastrointestinal tract, as well as the kidneys and nervous systems. High exposures can lead to skin rashes, muscle weakness and memory loss. • Organic mercury can cause damage to the central nervous system and neurological problems. Extreme exposures can lead to death.
Recommend
More recommend