
SLIDE 1
Mediterranean Costal Regions: Thermaikos Gulf (Greece) modeling - - PowerPoint PPT Presentation
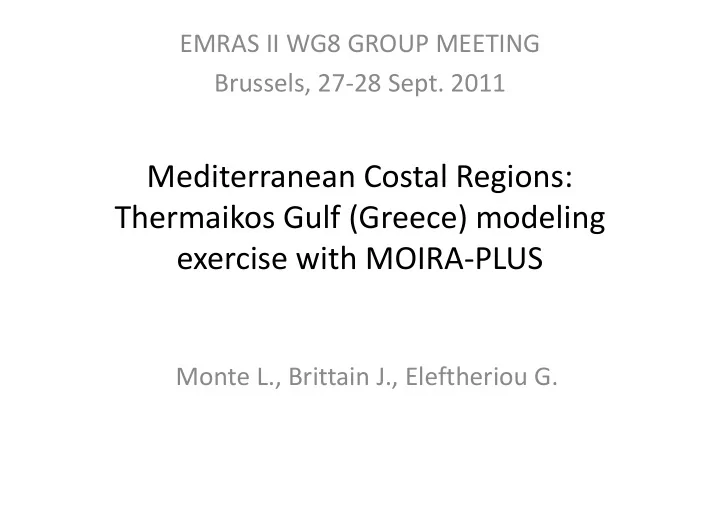
EMRAS II WG8 GROUP MEETING Brussels, 27 28 Sept. 2011 Mediterranean Costal Regions: Thermaikos Gulf (Greece) modeling exercise with MOIRA PLUS Monte L., Brittain J., Eleftheriou G. Thermaikos Gulf, Thessaloniki Arguments for the scenario
MOIRA‐PLUS modifications:
(Marine comp.)
sediment migration rate, bioaccumulation factors...)
a) Radionuclides' accumulation: predator (water and food chain), prey (only from water), b) Mobility: stationary (no movement) and non‐ stationary (random walk between compartments) Gulf hydrology:
BSWater income, rivers, catch. run off)
comp.
Fishes (predators, non‐stationary)
Box number Name Average depth (m) Average length (km) Average width (km) Average flux (m2/month) Catchment area (km2) 1 Gallikos River 0.49 65.00 0.03 3.09E+07 9.30E+02 2 Axios River 1.29 388.00 0.08 2.64E+08 2.37E+04 3 Loudias River 0.67 130.00 0.04 6.10E+07 1.00E+03 4 Aliakmon River 0.71 322.00 0.05 6.97E+07 9.25E+03 5 Pinios River 1.04 216.00 0.07 1.64E+08 1.08E+04 6
Thermaikos Gulf 72.50 67.30 22.70 7.50E+02 7
Thermaikos Gulf 16.32 17.40 7.80 3.00E+01 8 Thessaloniki Gulf 40.37 14.50 19.30 9
Thermaikos Gulf 31.23 16.40 9.40 10
Thermaikos Gulf 81.20 67.30 25.60
1986 1988 1990 1992 1994 1996 20 40 60 80 100 120 140
Cs-137 (Bq m-3)
Year
Sampling Location Date Concentration (Bq/kg or Bq/m^3) Type Reference Average Min Max Western Thermaikos 2004 ‐ 2006 0.1 0.07 0.13 Mussels (Thebaultt, 2008) Western Thermaikos May‐2000 1.4 1.11 1.69 Mussels (Katsiki, 2006) Thermaikos Gulf 1999‐2001 0.92 0.24 1.6 Mussels (Florou, 2002) North Agean Sea 1986‐1987 7.1 5.3 8.9 Mussels 1984‐1985 0.68 0.58 0.78 Mussels 1988‐1995 0.46 0.18 0.74 Mussels Aegean Sea 1985 0.63 ‐ ‐ Mussels (Pappuci, 1996) 1987 0.55 ‐ ‐ Mussels 1988 0.53 ‐ ‐ Mussels 1989 0.3 ‐ ‐ Mussels 1985 0.93 0.31 1.55 Fish 1987 0.37 0.06 1.24 Fish 1988 0.66 0.31 1.28 Fish 1989 0.9 ‐ ‐ Fish 1990 0.51 0.31 1.13 Fish NorthEast Aegean 1984‐1985 0.34 0.27 0.41 Fish (Florou, 2006) 1986 10.14 2.69 17.59 Fish 1987‐1995 0.65 0.28 1.02 Fish 1984‐1985 2.42 2.08 2.76 Sediment 1986‐1987 4.54 2.55 6.53 Sediment 1988‐1995 1.88 0.92 2.84 Sediment Thermaikos Gulf 2005 15 5 30 Sediment (Euaggelou, 2011) 2007 25 5 35 Sediment Thessaloniki Gulf 2006 41 22 22 Sediment (Tsabaris, 2011) Inner Thermaikos Sept ‐ 2001 38 34 41 Sediment (Karagiorgis, 2005) Outer Thermaikos Sept ‐ 2001 20 5 35 Sediment NorthEast Aegean 1984‐1985 2.7 2.42 2.98 water (Florou, 2006) 1986‐1987 20.7 17.9 23.5 water 1988‐1995 20.7 6 35.4 water Thessaloniki Gulf 2009 5.7 2.1 14.7 surf water (Florou, 2011) NorthEast Aegean Dec ‐ 2005 5.5 4.6 7.3 surf water (Evangeliou, 2009) Jun ‐ 2006 10.3 8.5 12.8 surf water Eastern Mediteranian 1995‐1997 3.6 3.3 4 surf water (Delfanti,2003) Outer Thermaikos 2003 4.8 4.5 5.1 surf water (Tsabaris, pr. com.)
0.1 1 10 100 1000 10000 50 100 150 200
137Cs concentration in water (Bq m‐3)
Months from January 1986
Thermaikos Gulf
model output compartment 1 comparment 2 compartment 3 compartment 4 compartment 5 Radionuclide concentration in water (empirical) 1 10 100 1000 10000 5 10 15
1 10 100 1000 10000 50 100 150 200
137Cs concentration in sediment (Bq kg‐1)
Months from January 1986
Thermaikos Gulf
model output compartment 1 comparment 2 compartment 3 compartment 4 compartment 5 Radionuclide concentration in sediment (empirical)
0.01 0.1 1 10 100 1000 10000 50 100 150 200
137Cs concentration in mussels (Bq kg‐1)
Months from January 1986
Thermaikos Gulf
model output compartment 1 comparment 2 compartment 3 compartment 4 compartment 5 Radionuclide concentration in mussels (empirical)
0.01 0.1 1 10 100 1000 10000 50 100 150 200
137Cs concentration in fish (Bq kg‐1)
Months from January 1986
Thermaikos Gulf
model output compartment 1 comparment 2 compartment 3 compartment 4 compartment 5 Radionuclide concentration in fish (empirical)
Marine Box 0-5 yr 6-15 yr 16 < yr 6 5,224 3,527 55,860 7 3,083 2,062 31,141 8 76,043 53,391 812,982 9 14,429 9,594 147,443 10 32,317 21,707 320,524
Marine Box Fish Mussels 6 1,011,6901 7 247,713 8 217,342 9 422,918 6,551,750 10 12,243,426 3,527,865
1.00E‐05 1.00E‐04 1.00E‐03 1.00E‐02 1.00E‐01 1.00E+00 1st year 2nd year 10th year
137Cs dose rate (man.Sv yr‐1)
Year from depodition
Thermaikos Gulf
Total collective dose External dose Dose fr. intake fish
E1
Slide 12 E1
Moira Plus limitation
1.00E‐05 1.00E‐04 1.00E‐03 1.00E‐02 1.00E‐01 1.00E+00 1st year 2nd year 10th year
190Sr dose rate (man.Sv yr‐1)
Year from depodition
Thermaikos Gulf
Total collective dose External dose Dose fr. intake fish
1.00E‐05 1.00E‐04 1.00E‐03 1.00E‐02 1.00E‐01 1.00E+00 1st year 2nd year 10th year
Year from depodition
Thermaikos Gulf
cesium srodium
1.00E‐08 1.00E‐07 1.00E‐06 1.00E‐05 1st year 2nd year 10th year
Maximun dose to fish (mGy) Year from depodition
Thermaikos Gulf
cesium 0‐5yr 6‐15yr >16yr srodium 0‐5yr 6‐15yr >16yr
Cs‐137 Sr‐90
Location Adult 10 y 1 y Adult 10 y 1 y
Irish Sea: Cumbrian Waters 1.65E‐6 2.60E‐7 5.52E‐8 2.83E‐7 1.23E‐7 1.32E‐8 English Channel: Lyme Bay 9.45E‐7 1.49E‐7 7.62E‐9 1.32E‐7 5.72E‐8 6.13E‐9 North Sea: Norwegian Current Surface 6.16E‐7 9.70E‐8 2.06E‐8 8.72E‐8 3.79E‐8 4.07E‐9 Skagerrak 8.77E‐7 1.38E‐7 2.93E‐8 1.28E‐7 5.55E‐8 5.95E‐9 Baltic Sea: Gulf of Riga 2.58E‐6 4.06E‐7 8.62E‐8 4.22E‐7 1.84E‐7 1.98E‐8 Kara Sea: Ob Bay 2.86E‐6 4.51E‐7 9.57E‐8 5.09E‐7 2.21E‐7 2.37E‐8 Thermaikos Gulf 3.32E‐07 1.85E‐07 7.39E‐08 1.56E‐07 1.26E‐07 5.98E‐08
‐ Good agreement (order of magnitude) between different model predictions (MOIRA, NRPA) ‐ The same behavior with analogues closed costal environment ( Gulf of Riga) ‐ Perspectives: comparison with river and/or terrestrial contribution to the total dose