
SLIDE 1
15/08/2013 1
Measuring regional well‐being
Options and challenges
Natalie Stoeckl School of Business & The Cairns Institute
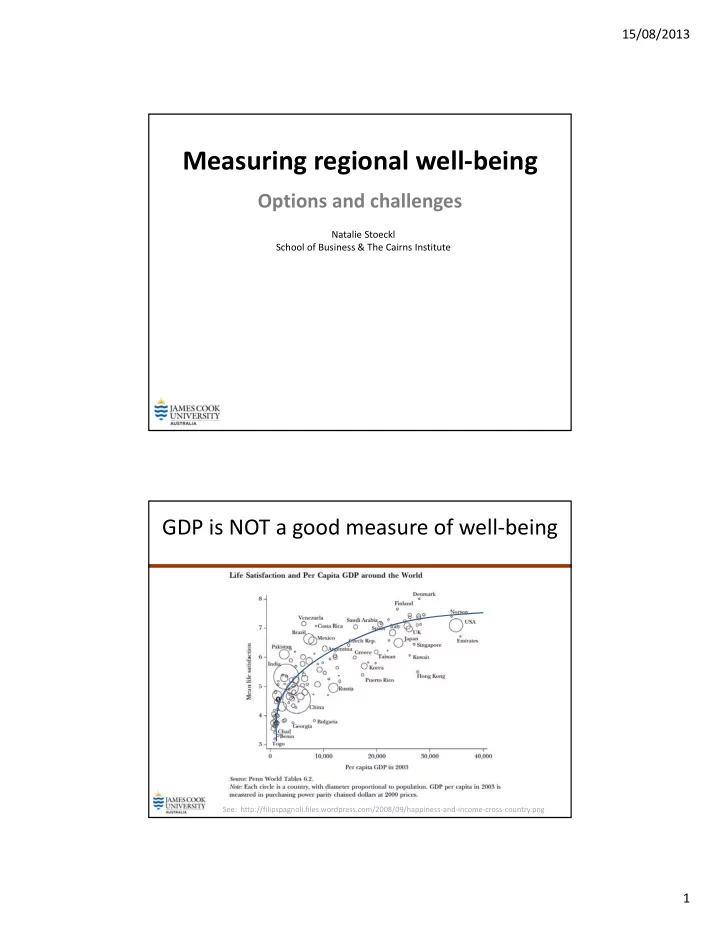
GDP is NOT a good measure of well‐being
See: http://filipspagnoli.files.wordpress.com/2008/09/happiness‐and‐income‐cross‐country.png