
SLIDE 1
11/17/2017 1
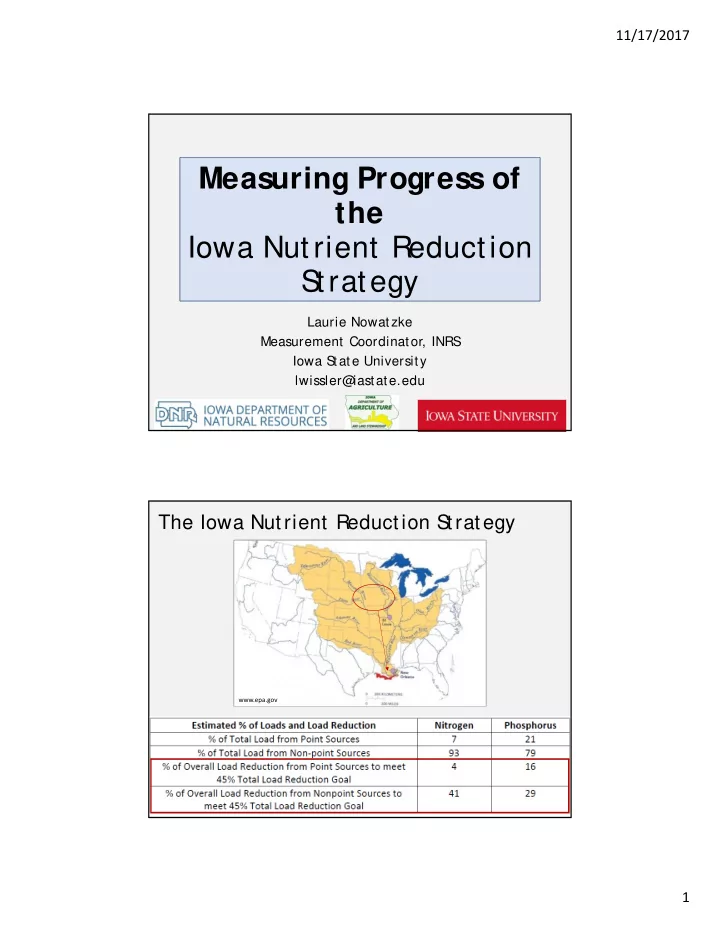
Measuring Progress of the Iowa Nutrient Reduction S trategy
Laurie Nowatzke Measurement Coordinator, INRS Iowa S tate University lwissler@ iastate.edu
www.epa.gov
Measuring Progress of the Iowa Nutrient Reduction S trategy - - PDF document
11/17/2017 Measuring Progress of the Iowa Nutrient Reduction S trategy Laurie Nowatzke Measurement Coordinator, INRS Iowa S tate University lwissler@ iastate.edu The Iowa Nutrient Reduction S trategy www.epa.gov 1 11/17/2017 1.
Laurie Nowatzke Measurement Coordinator, INRS Iowa S tate University lwissler@ iastate.edu
www.epa.gov
Nov 2012 First Draft of NRS for Public Comment May 2013 Release of NRS
Nov 2012 First Draft of NRS for Public Comment May 2013 Release of NRS 2014 First Annual Progress Report, 19 pages
Nov 2012 First Draft of NRS for Public Comment May 2013 Release of NRS 2014 First Annual Progress Report, 19 pages 2015 Second Annual Report, 37 pages
Nov 2012 First Draft of NRS for Public Comment May 2013 Release of NRS 2014 First Annual Progress Report, 19 pages 2015 Second Annual Report, 37 pages 2016 Third Annual Report, 44 pages
Nov 2012 First Draft of NRS for Public Comment May 2013 Release of NRS 2014 First Annual Progress Report, 19 pages 2015 Second Annual Report, 37 pages 2016 Third Annual Report, 44 pages 2017 Fourth Annual Report, 76 pages
5%
Note for online version: Please do not cite this slide’s results in other sources, as this analysis is in its early stages.