
SLIDE 1
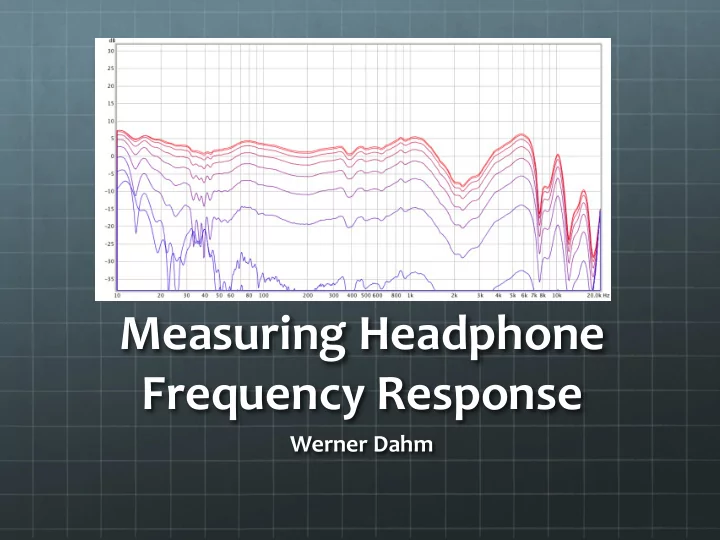
Measuring ¡Headphone ¡ Frequency ¡Response ¡
Werner ¡Dahm ¡
Measuring Headphone Frequency Response Werner Dahm The - - PowerPoint PPT Presentation
Measuring Headphone Frequency Response Werner Dahm The Basics Tools and Equipment youll need to measure headphone response REW: Room Equalization
Werner ¡Dahm ¡
Tools ¡and ¡Equipment ¡you’ll ¡need ¡to ¡measure ¡ headphone ¡response ¡
REW: ¡Room ¡Equalization ¡Wizard ¡
M3DMixer ¡only ¡for ¡OS ¡X ¡10.6 ¡and ¡older ¡(10.7 ¡doesn’t ¡need ¡ it) ¡
Phantom ¡Power ¡Supply ¡(9V) ¡ Panasonic ¡WM-‑61a ¡electret ¡capsule ¡mic ¡ One ¡or ¡two ¡RCA ¡male ¡to ¡1/8” ¡female ¡cables ¡ One ¡male ¡1/8” ¡TRS ¡to ¡male ¡1/8” ¡TRS ¡cable ¡ Headphones ¡to ¡measure ¡
Using ¡a ¡reference ¡schematic ¡from ¡a ¡friend, ¡ determined ¡the ¡correct ¡components ¡ ¡
WM-‑61a ¡ Mic ¡ 9V ¡Battery ¡ 2.2kΩ ¡ 2.2kΩ ¡ 3.3μF ¡ 3.3μF ¡ To ¡LINE-‑IN ¡
Since ¡the ¡Panasonic ¡WM-‑61a ¡is ¡a ¡well-‑regarded ¡ measurement ¡electrec ¡capsule ¡mic, ¡it ¡has ¡its ¡own ¡ calibration ¡file ¡readily ¡available ¡online ¡
Screenshot ¡from ¡Keith ¡Atkins ¡
Before ¡measurements ¡are ¡accurate, ¡the ¡user ¡must ¡ calibrate ¡their ¡recording ¡system ¡
Includes ¡everything ¡before ¡the ¡headphones ¡and ¡mic ¡
DAC/Soundcard ¡ Amp ¡ Phantom ¡power ¡supply ¡
We ¡do ¡this ¡calibration ¡by ¡creating ¡a ¡feedback ¡loop ¡ and ¡using ¡the ¡software ¡to ¡make ¡corrections ¡to ¡ account ¡for ¡non-‑linearity ¡in ¡the ¡system ¡
Laptop ¡Audio ¡ Output ¡ Headphone ¡Amp ¡ DAC ¡ Phantom ¡ PS ¡ Laptop ¡Mic ¡Line-‑In ¡
Screenshot ¡from ¡Keith ¡Atkins ¡
Image ¡from ¡John ¡Conover’s ¡site: ¡http://www.johncon.com/john/wm61a/ ¡
Connect ¡the ¡mic ¡to ¡the ¡left ¡channel ¡of ¡the ¡RCA ¡to ¡1/8” ¡ male ¡cable ¡ Connect ¡this ¡cable ¡to ¡the ¡input ¡(mic) ¡side ¡of ¡the ¡phantom ¡ power ¡supply ¡ Connect ¡the ¡1/8” ¡male ¡to ¡male ¡cable ¡from ¡the ¡phantom ¡ power ¡supply ¡output ¡to ¡the ¡mic ¡line-‑in ¡on ¡the ¡laptop ¡ ¡ Hook ¡up ¡the ¡headphones ¡as ¡if ¡you ¡were ¡going ¡to ¡listen ¡to ¡ music ¡(Audio ¡Out ¡USB ¡à à ¡DAC ¡à à ¡Amp ¡à à ¡Headphones) ¡ Position ¡the ¡mic ¡in ¡your ¡ear ¡carefully, ¡and ¡place ¡ headphones ¡on ¡your ¡head ¡
Screenshot ¡from ¡Keith ¡Atkins ¡
After ¡measurements ¡have ¡been ¡taking, ¡set ¡up ¡of ¡the ¡ limits ¡needs ¡to ¡be ¡done ¡in ¡order ¡interpret ¡the ¡graphs ¡ correctly ¡ The ¡y-‑axis ¡(dB) ¡should ¡be ¡in ¡5 ¡dB ¡intervals ¡ The ¡x-‑axis ¡(Hz) ¡should ¡range ¡from ¡20Hz ¡to ¡20,000Hz ¡ in ¡a ¡logarithmic ¡scale ¡ The ¡offset ¡must ¡be ¡set ¡to ¡general ¡“guess” ¡where ¡0 ¡dB ¡ might ¡be ¡to ¡obtain ¡a ¡good ¡representation ¡of ¡the ¡data ¡
Screenshot ¡from ¡Keith ¡Atkins ¡
Can ¡see ¡changes ¡in ¡the ¡frequency ¡response ¡due ¡to ¡ modifications ¡with ¡consistent ¡measurement ¡ techniques ¡ ¡
REW ¡can ¡plot ¡data ¡in ¡many ¡different ¡ways ¡ Need ¡to ¡choose ¡the ¡type ¡of ¡graph ¡given ¡your ¡specific ¡ interest ¡ Types ¡of ¡graphs ¡available: ¡
SPL ¡& ¡Phase ¡ All ¡SPL ¡ Impulse, ¡Filtered ¡IR, ¡GD, ¡RT60, ¡Decay ¡ Waterfall ¡ Spectrogram ¡ Scope ¡