measures of spread
play

Measures of Spread MDM4U: Mathematics of Data Management The range - PDF document

s t a t i s t i c s o f o n e v a r i a b l e s t a t i s t i c s o f o n e v a r i a b l e Measures of Spread MDM4U: Mathematics of Data Management The range of a data set is the difference between the lowest and highest data. This is of


  1. s t a t i s t i c s o f o n e v a r i a b l e s t a t i s t i c s o f o n e v a r i a b l e Measures of Spread MDM4U: Mathematics of Data Management 
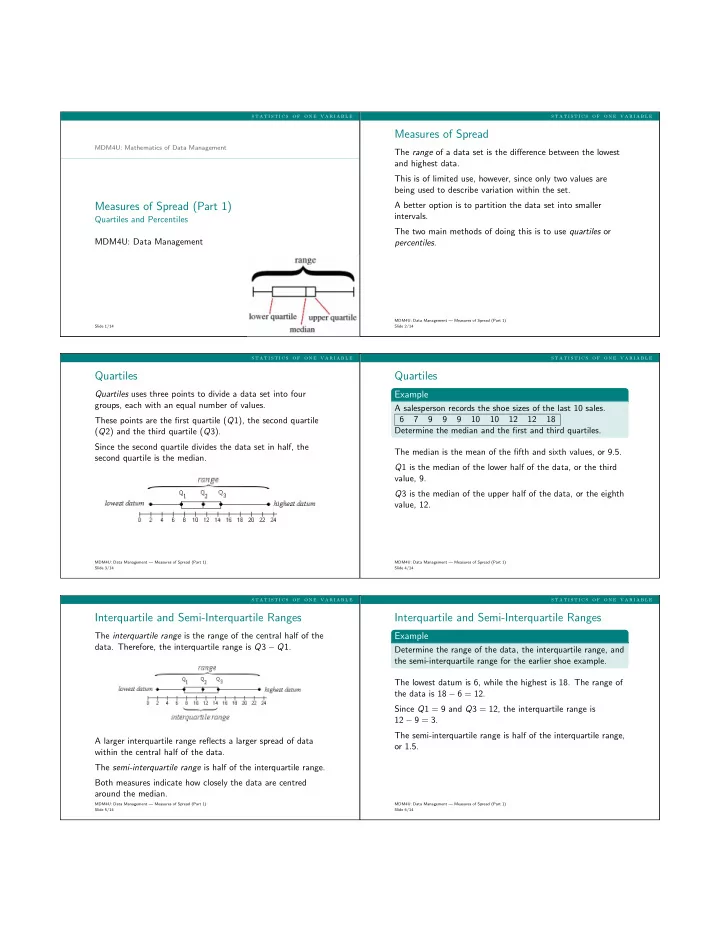
The range of a data set is the difference between the lowest and highest data. This is of limited use, however, since only two values are being used to describe variation within the set. Measures of Spread (Part 1) A better option is to partition the data set into smaller intervals. Quartiles and Percentiles The two main methods of doing this is to use quartiles or MDM4U: Data Management percentiles . MDM4U: Data Management — Measures of Spread (Part 1) Slide 1/14 Slide 2/14 s t a t i s t i c s o f o n e v a r i a b l e s t a t i s t i c s o f o n e v a r i a b l e Quartiles Quartiles Quartiles uses three points to divide a data set into four Example groups, each with an equal number of values. A salesperson records the shoe sizes of the last 10 sales. These points are the first quartile ( Q 1), the second quartile 6 7 9 9 9 10 10 12 12 18 Determine the median and the first and third quartiles. ( Q 2) and the third quartile ( Q 3). Since the second quartile divides the data set in half, the The median is the mean of the fifth and sixth values, or 9.5. second quartile is the median. Q 1 is the median of the lower half of the data, or the third value, 9. Q 3 is the median of the upper half of the data, or the eighth value, 12. MDM4U: Data Management — Measures of Spread (Part 1) MDM4U: Data Management — Measures of Spread (Part 1) Slide 3/14 Slide 4/14 s t a t i s t i c s o f o n e v a r i a b l e s t a t i s t i c s o f o n e v a r i a b l e Interquartile and Semi-Interquartile Ranges Interquartile and Semi-Interquartile Ranges Example The interquartile range is the range of the central half of the data. Therefore, the interquartile range is Q 3 − Q 1. Determine the range of the data, the interquartile range, and the semi-interquartile range for the earlier shoe example. The lowest datum is 6, while the highest is 18. The range of the data is 18 − 6 = 12. Since Q 1 = 9 and Q 3 = 12, the interquartile range is 12 − 9 = 3. The semi-interquartile range is half of the interquartile range, A larger interquartile range reflects a larger spread of data or 1 . 5. within the central half of the data. The semi-interquartile range is half of the interquartile range. Both measures indicate how closely the data are centred around the median. MDM4U: Data Management — Measures of Spread (Part 1) MDM4U: Data Management — Measures of Spread (Part 1) Slide 5/14 Slide 6/14

  2. s t a t i s t i c s o f o n e v a r i a b l e s t a t i s t i c s o f o n e v a r i a b l e Box-and-Whisker Plots Box-and-Whisker Plots Quartiles can be illustrated using box-and-whisker plots . Example Illustrate the data from the shoe example using a A box shows Q 1, the median, and Q 3. So the box shows the box-and-whisker plot. interquartile range. Two whiskers extend to the lowest and the hightest data. This shows the range of the data set. MDM4U: Data Management — Measures of Spread (Part 1) MDM4U: Data Management — Measures of Spread (Part 1) Slide 7/14 Slide 8/14 s t a t i s t i c s o f o n e v a r i a b l e s t a t i s t i c s o f o n e v a r i a b l e Box-and-Whisker Plots Box-and-Whisker Plots A modified box-and-whisker plot is used when there are Example outliers in the data. Illustrate the data from the shoe example using a modified Outliers are not included in the whiskers, but are indicated as box-and-whisker plot. separate points. By convention, an outlier is any data point whose distance from the box is at least 1.5 times the width of the box. Modified box-and-whisker plots typically illustrate the spread of the data more effectively. MDM4U: Data Management — Measures of Spread (Part 1) MDM4U: Data Management — Measures of Spread (Part 1) Slide 9/14 Slide 10/14 s t a t i s t i c s o f o n e v a r i a b l e s t a t i s t i c s o f o n e v a r i a b l e Percentiles Percentiles Example Percentiles divide a data set into one hundred equally-sized intervals. The marks of 40 students who wrote a standardized test are below. Therefore, the n th percentile, P n , contains n % of the data. 35 38 38 44 47 53 54 56 57 59 It follows that (100 − n )% of the data are greater than or 62 62 63 65 65 68 68 69 70 71 equal to P n . 72 72 72 74 75 79 81 83 85 85 88 89 91 93 94 94 95 97 97 98 • Determine the 80th percentile of the data. • What mark would a student have to score to be at the 60th percentile? • What percentile corresponds to a test score of 77? MDM4U: Data Management — Measures of Spread (Part 1) MDM4U: Data Management — Measures of Spread (Part 1) Slide 11/14 Slide 12/14

  3. s t a t i s t i c s o f o n e v a r i a b l e s t a t i s t i c s o f o n e v a r i a b l e Percentiles Questions? The 80th percentile is the boundary between the lower 80% of the scores and the top 20%. 80% of 40 is 32, so the 80th percentile is the mean of the 32nd and 33rd data, or 90. To be at the 60th percentile, a student would have to score better than 60% of his/her classmates. 60% of 40 is 24, so the 60th percentile is the mean of the 24th and 25th data, or 74.5. A test score of 77 lies between the 25th and 26th data. Since 25 40 = 62 . 5%, the test score corresponds to the 63rd percentile. MDM4U: Data Management — Measures of Spread (Part 1) MDM4U: Data Management — Measures of Spread (Part 1) Slide 13/14 Slide 14/14

Download Presentation
Download Policy: The content available on the website is offered to you 'AS IS' for your personal information and use only. It cannot be commercialized, licensed, or distributed on other websites without prior consent from the author. To download a presentation, simply click this link. If you encounter any difficulties during the download process, it's possible that the publisher has removed the file from their server.

Recommend


More recommend