Measured effects of a high PV penetration to a communal low voltage - - PowerPoint PPT Presentation

measured effects of a high pv
SMART_READER_LITE
LIVE PREVIEW

Measured effects of a high PV penetration to a communal low voltage - - PowerPoint PPT Presentation

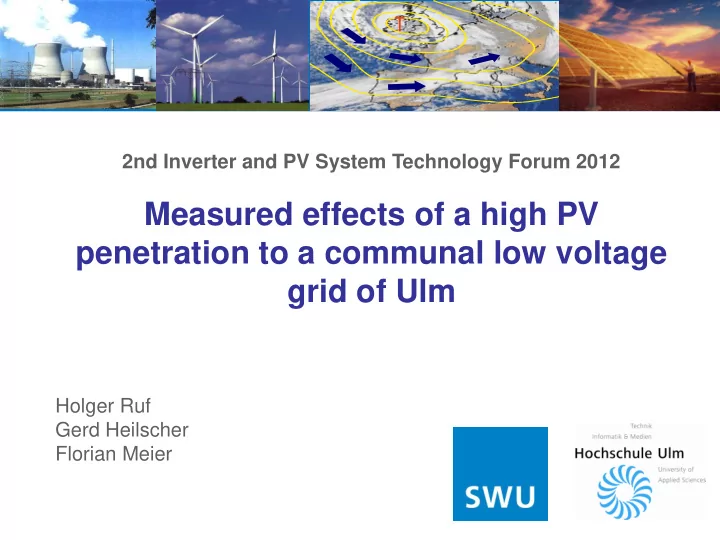
T 2nd Inverter and PV System Technology Forum 2012 Measured effects of a high PV penetration to a communal low voltage grid of Ulm Holger Ruf Gerd Heilscher Florian Meier 1 Contents Distribution grid - utility of Ulm High


slide-1
SLIDE 1

1

T

Measured effects of a high PV penetration to a communal low voltage grid of Ulm

Holger Ruf Gerd Heilscher Florian Meier 2nd Inverter and PV System Technology Forum 2012

slide-2
SLIDE 2

2

Contents

 Distribution grid - utility of Ulm  High penetration of PV in low voltage grid  Grid operators point of view  Test site

 Definition  Measurements  Potential

 Conclusion & Outlook

slide-3
SLIDE 3

City of Ulm

 Highest church tower in the

world

 Number One in the

German Solar Bundes League

3

ULM

Source: www.wolframalpha.com tourismus.ulm.de

slide-4
SLIDE 4

Key Figures of the Distribution Grid

Utility of ULM, Germany

 Low voltage grid

 252 km aerial line  1446 km cable  5523 transformers  49,771 loads  332 km² grid area  > 200 000 inhabitants

 Load

 110 MW on

summer Sundays

 220 MW maximum

Source: www.swu.de, EEG Anlagenregister, October 2011

86 MW complete, 42 MWp PV in low voltage

4

slide-5
SLIDE 5

Feed in to Grid greater than Load

Utility of Ulm, Germany

20.000 40.000 60.000 80.000 100.000 120.000 140.000 160.000 180.000 200.000 220.000

1992 1994 1996 1998 2000 2002 2004 2006 2008 2010 2012 2014 2016 2018 2020

Grid Load kW

Solar Power (EEG) Biomass (EEG) Hydro Power (EEG)

Real Estimate

Max Load

Max Load Sunday Feed in greater than load

Source: www.swu.de, EEG Anlagenregister, August 2011, own calculation 5

slide-6
SLIDE 6

Grid Operators Point of View

 Solar power is driving day to day grid upgrades  Forward looking planning impossible today  Drafted budget for transformer exchange

already used in first half of the year

6 6

slide-7
SLIDE 7

First test site

7 ZSW-BMU_Quer 7

  • > 130 houses
  • 17 PV, total ~200kWp
  • 1 transformer (630kVA)
  • 0,2 km²

Holger Ruf

Only 17 PV Systems on the 130 Roofs up to now

slide-8
SLIDE 8

First test site grid measurement

 Voltage and

Power

 1 s resolution  10 channels  Large memory

8

+ =

 0.176 km² area  630 kVA

transformer

 8 outgoing lines  > 130 Loads  17 PVs (~200kWp)

 Real time

measurements

 Since 30th March

2011

slide-9
SLIDE 9

Active Power

9

slide-10
SLIDE 10

Voltage

10

slide-11
SLIDE 11

Active Power

11

slide-12
SLIDE 12

Voltage

12

slide-13
SLIDE 13

Solar Potential of Test Site – Today and Tomorrow

Maximum development

 Today:

 133 Houses  200 kWp / 17 PV = ~12kWp/House

 Tomorrow:

 133 Houses  conservative (5kWp/House)  650 kWp  actual (12kWp/House)  1560 kWp

13

slide-14
SLIDE 14

Solar Potential of Test Site – Tomorrow Effects

 Problems without grid development  Violation of voltage tolarance according to EN

60038 (± 10% Vn)

 Violation of fast voltage transient according to

VDE-AR-N 4105 (≤ 3% Vn)

 Reduced life time of transformers caused of

thermal overload

 Increase of power electronics 

electromagnetic compatibility (EMC) problems

14

slide-15
SLIDE 15

PV influence on the grid (1)

 Voltage tolerance

violation

 Reversal load flow

Source: TU München, Prof. Witzmann 15

slide-16
SLIDE 16

PV influence on the grid (2)

 Thermal

  • verload

transformer and cable possible

 PPV/STr >1,5

increase ageing

Source: TU München, Prof. Witzmann 16

slide-17
SLIDE 17

ENDORSE - Local solar power forecast

17

Consumption Generation 1h predicted Generation 122 kW 250 kW 5 kW 5 minutes 3x5 km/pixel Clouds detected

slide-18
SLIDE 18

Next Steps to Smart Solar Grid

  • Determination
  • f solar potential

for every roof / grid access point

  • Calculation of

energy flow

  • Evaluation of

influences to the grid

  • Detailed plan/cost

for grid upgrade

  • Smart Metering
  • Solar power forecast
  • Load management

18

slide-19
SLIDE 19

Contact

Florian Meier SWU Netze GmbH

  • Karlstr. 1

D-89075 Ulm florian.meier@swu.de

  • Prof. Gerd Heilscher, Holger Ruf

Ulm University of Applied Sciences Eberhard Finckh Str. 11 D-89075 Ulm heilscher@hs-ulm.de ruf@hs-ulm.de

19